Part 3: An EMR Analytics Solution
In the first post of this series I discussed the value of analytics as well as the three pillars associated with a healthcare data analytics strategy. In the second post, I focused on some of the challenges with analytics and tools to help. In the final part of this series, I focus on Modernizing Medicine’s Analytics solution including frequently used reports and what’s coming next.
A Premium EMR Analytics Solution
A premium analytics bundle is what truly allows you to execute a strong data strategy, particularly across our products. This is currently available for dermatology, and other verticals are coming soon. I’ll highlight some of the key items available on our premium platform.
On the getting started page, you’ll have a nice overview and see things like Practice Senses and Relative Value Units (RVU) Senses. This allows you to track the number of patients by volume or number of patients by RVUs for those who use our dermatology practice management system.
Today, I’ll highlight some of the key items available on our premium platform. On the getting started page, you’ll have a nice overview and see things like Practice Senses and Relative Value Units (RVU) Senses. This allows you to track the number of patients by volume or number of patients by RVUs for those who use our dermatology Practice Management system.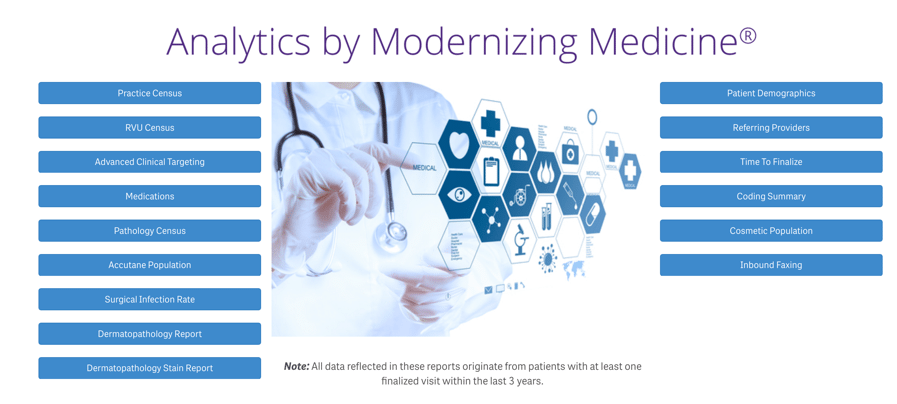
Frequently Used EMR Analytics Reports: Advanced Clinical Targeting Report
Our most popular report is Advanced Clinical Targeting, which our team designed to solve multiple needs. First, it’s made to identify cohorts of patients. It should identify cohorts of patients that did or did not complete certain tasks. This helps when you want to look for patients who may have fallen through the cracks, for example someone who should have come in for a melanoma screening but did not. Perhaps you want to look at patients who came in for one Botox, but never returned. And maybe it’s patients who you’ve ordered bone density studies for on a regular basis, but haven’t seen for several years. This report allows you to pull a detailed patient list based off a set of different parameters.
Perhaps you want to pull data on patients with ICD-9 and ICD-10 codes associated with melanoma. It will pull a patient list that you could immediately download into a clean Excel worksheet without a bunch of jumbled fields, so it can be easily manipulated.
Now what if you wanted to add some more information? Say you have your melanoma patients listed but you only want to see who came in during 2015 and 2016. You could now take that list and narrow it down. Maybe that’s the data you were looking for, but then you want to see who did not come in this year. You could generate a list of patients who were seen for melanoma in 2015-16 who have not yet been seen in 2017. The combinations are endless, and the combinations and features are added on an ongoing basis.
You can add items like medications too. You can filter by specific biopsy results, specific referring providers, specific diagnoses and more. This ability to combine any data point enables you to create exclusion lists to nail down patients who you either want to market new services to or you want to figure out where they went. This is the core of one of our advanced Analytics offerings.
Frequently Used EMR Analytics Reports: Patient Demographics Information
The next most popular piece is our patient demographics information. You can look at your patient demographics across age groups and drill down. Perhaps you want to look at patients aged 51 through 80 and add a specific diagnosis. You can also create a patient distribution by zip code and focus on a geographic area. For instance if you pull up Boston and scroll in, you can get into the map details as you would on Google Maps.
Users can view gender, ethnicity, race and a patient’s primary insurance in our dashboards, and create a data table. Referring provider information enables you to see who sends you patients. Plus review items such as how long it takes each provider to finalize notes, as well as having the ability to create a billing summary or a coding summary. This is helpful especially if you use a third-party practice management system. You’ll be able to see exactly what prints on the EMA superbill and launch a data table that can then be downloaded. You can even provide your billing staff with access to this data.
In our premium Analytics you’ll see the recurring theme of helping to solve for the three pillars of a data strategy. Where possible, we want to provide complete datasets, and connect billing information such as ICD-10 and CPT code modifiers with clinical information and that doesn’t yet require our practice management system. Rather, as our Modernizing Medicine database begins to grow and grow, we’ll start to connect things like reimbursement rates, allowables and insurance distributions to clinical data to help you better understand your payer distributions’ impact on your clinical practice.
This tool is easy to use, so you can avoid the data island by starting with the same data sets across the board of your organization and drilling from the orchard level view, all the way down into the trees, down to the branch and then down into the apples. This allows you to look at things in more detail from a population health aspect answering the hard questions of building cohorts of patients such as who did what, who didn’t do what, and who didn’t follow through on particular metrics.
This is in addition to looking at subjects like care access, which include:
- Where do my patients live?
- How far do my patients travel?
- Where are my referrals based from?
- Should I consider a satellite office? If so, where?
You’ll also have the ability to identity revenue gaps including:
- Who got the work up, but didn’t execute?
- Who’s late on the recurring preventative services?
- Who should I be marketing to for cash-generating service lines?
We’ve worked through compliance and patient population management, but we also can do audit risk. Am I billing specific coding levels at a different rate than the current CMS data or the current EMA comparisons? With Analytics, you can find out by looking physician by physician for outliers or for ones that might need more education on proper coding.
The Next Frontier of Healthcare Data Analytics
As you take a look at the orchard, you as a practice need to evaluate if you have enough land, if you will get enough sun, if you are growing the right fruit and if you have any bad apples. The future is being able to combine data sets, but specifically to combine things that haven’t been combined yet.
Let’s look at an example. If we want to look at say clinical outcome “A,” you could plug this into any medical outcome. We want to be able to provide you with the ability to look at the variables that could affect your clinical outcome and that insurance companies want to judge you on.
We want to be able to give you the ability to look at clinical outcome “A” by practice variables:
- Does this look different by location?
- Does this look different by provider?
- Does it look different if the patient wait time was a week, two weeks, a month, six months, before they were able to be seen?
- Does it vary by the time that the patient spent in the waiting room or time they spent with staff?
- Does it vary depending on the staff they spent time with?
- Does it vary by provider?
We want you to be able to cross-reference those outcomes by patient variable by asking these questions:
- Does it look different by age, by comorbidity, by geographic location?
- Do certain patients who are referred by specific referring providers have different outcomes profiles?
- How do these compare with satisfaction metrics?
- What do the outcomes look like when they’re correlated with different medications?
We want to empower you to ask questions and have them answered with Analytics. You would be able to ask about the hard outcomes and be able to find the correlations which might be driving your specific trends. This is coming soon to our Analytics package and certainly something to look forward to!
EMR Data Analytics: Deep Insights. Better Outcomes.
You want the analytics platform you use to provide a full suite of in-depth outcomes trending to help you improve patient care, with reports covering CPT, E&M, ICD-10, visit volume trends and more. It should help unlock actionable insights to improve your practice. With just a few clicks, you should be able to drill down from a facility level to a provider level and to the individual patient level, making it easy to identify and track key metrics. When you can see in real time how you’re doing clinically, financially and operationally, you can uncover ways to increase efficiency, revenue, cost-effectiveness and quality of care at your practice.
And in case you missed it, read part one and part two of this analytics blog series and watch the full webinar here.