Which Data Analytics to Track at Your OBGYN Practice
Learn how our analytics platform can help OBGYNs track financials and clinical outcomes, and benchmark their performance.
One of the major benefits of using ModMed’s OBGYN electronic health record (EHR) is the ease with which you can collect, track and analyze data. Our centralized software solution lets you manage your workflows and operations as you go about your day, helping to create broad data sets that pull information from patient visits and engagement, billing workflows and compliance documentation.
This data is fully available to you within ModMed and holds the potential for you to surface insights for greater cost efficiency and revenue growth, while discovering how internal and external trends may impact your finances and operations:
- See data in multiple ways. Dive deep into raw data, scan tables, and get the picture with data visualizations that show you what you need to know at a glance.
- Solve challenges. Monitor workflows, check scheduling metrics, compare staff productivity and analyze staff effectiveness at assisting providers. Build efficiency at busy practices.
- Discover opportunities. Track costs and payments. Make decisions based on structured data that could help you learn how to grow your practice.
The following is a review of some of ModMed’s data analysis options and how OBGYNs can use them to optimize care.
Types of Analytics for OBGYNs
The information in your data analytics can position you to improve patient relationships, keep patients coming back, discover extended service offers, capture missing payments before it’s too late and optimize staff productivity. Dive into reports, charts, tables and other visualizations to understand more about your practice:
- Financial analytics: These data points help you understand key performance indicators that impact your financial strength. They may reveal revenue growth opportunities or trends that are costing you money.
- Clinical analytics: Your clinical data can help you discover patterns across your patients, like visit volumes and coding trends, so that you can ensure continuous, high-quality care.
- Operational analytics: This data can help you discover the details of your office’s daily workflows, allowing you to see where bottlenecks may be occurring, which staff may be working with which providers, or how telehealth contributes to your practice.
OBGYN Clinical Analytics
Advanced Clinical Targeting
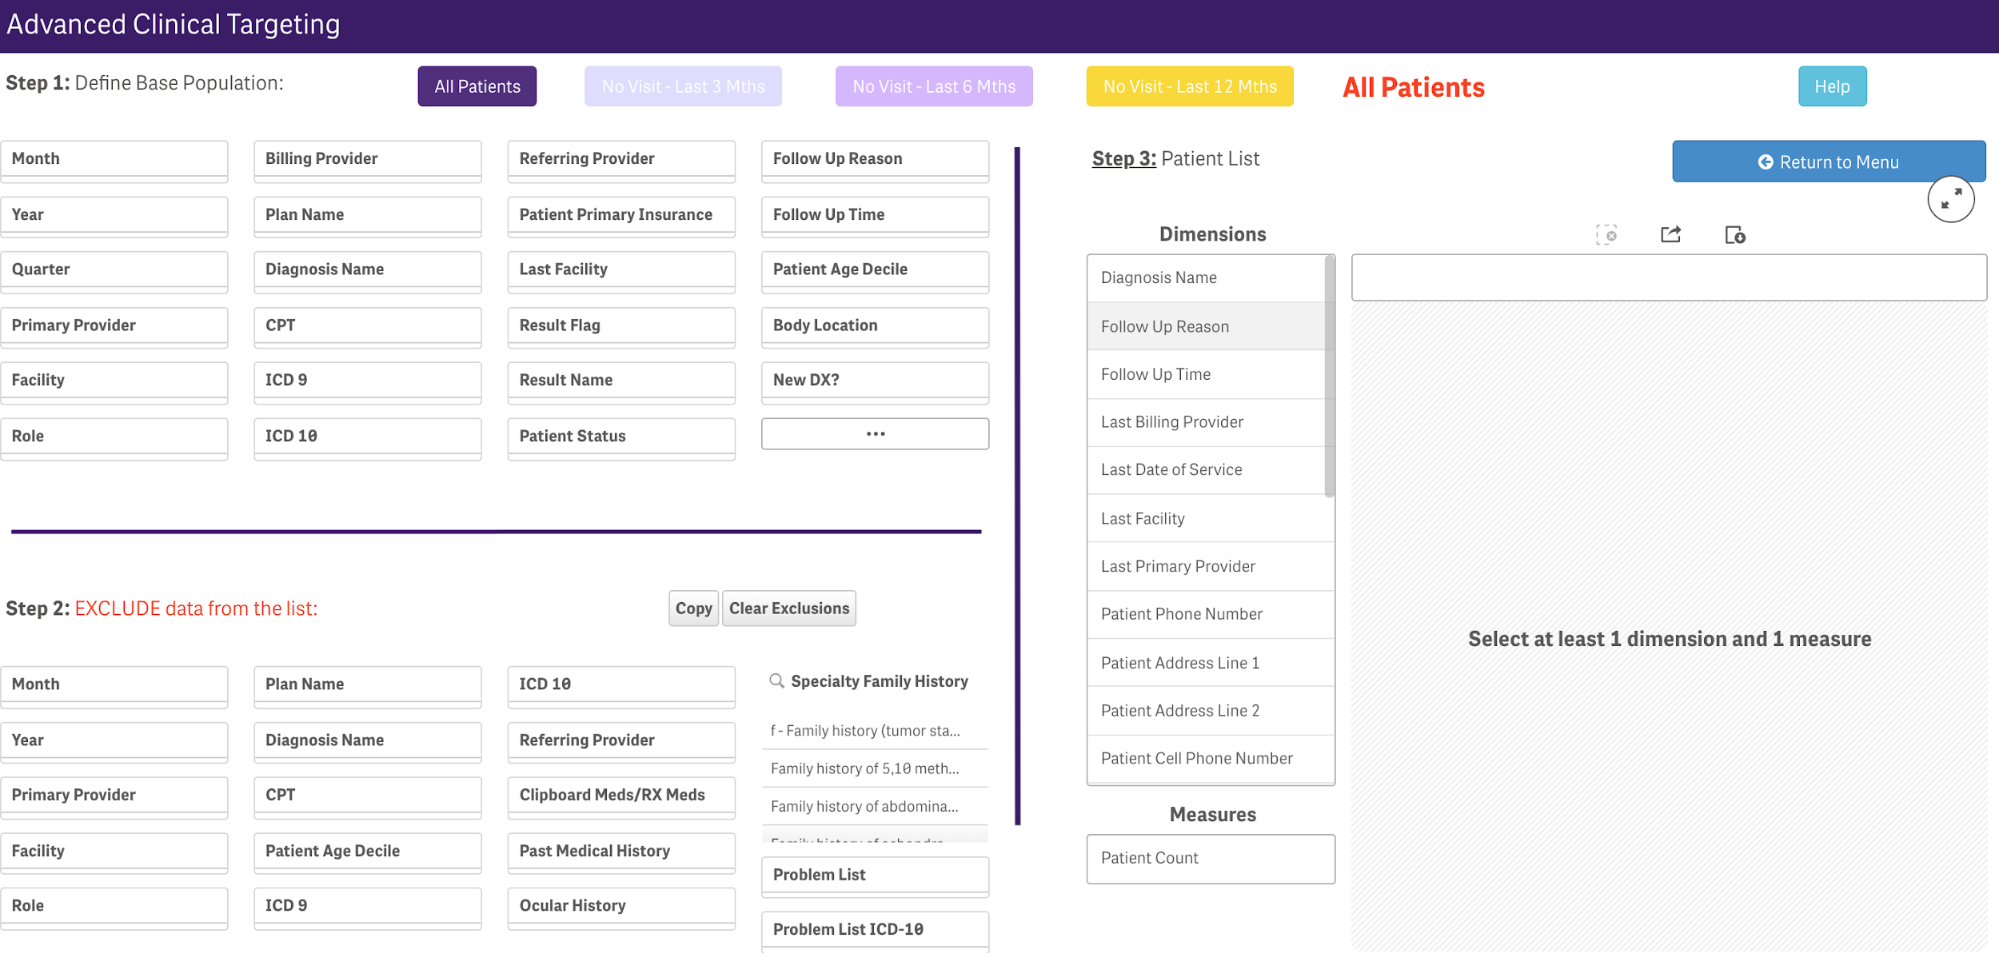
What It Shows: Include or exclude specific criteria to uncover clinical gaps and opportunities related to your individual patients or groups of patients. You can also use quick buttons to make sure follow-up visits happen as recommended.
Why You Need It: This data matters because it helps prevent missed details that could impact patient outcomes. This is particularly important for OBGYNs because there may be cases where there are limited time frames, like a pregnancy, to provide quality care.
OB Projection Report
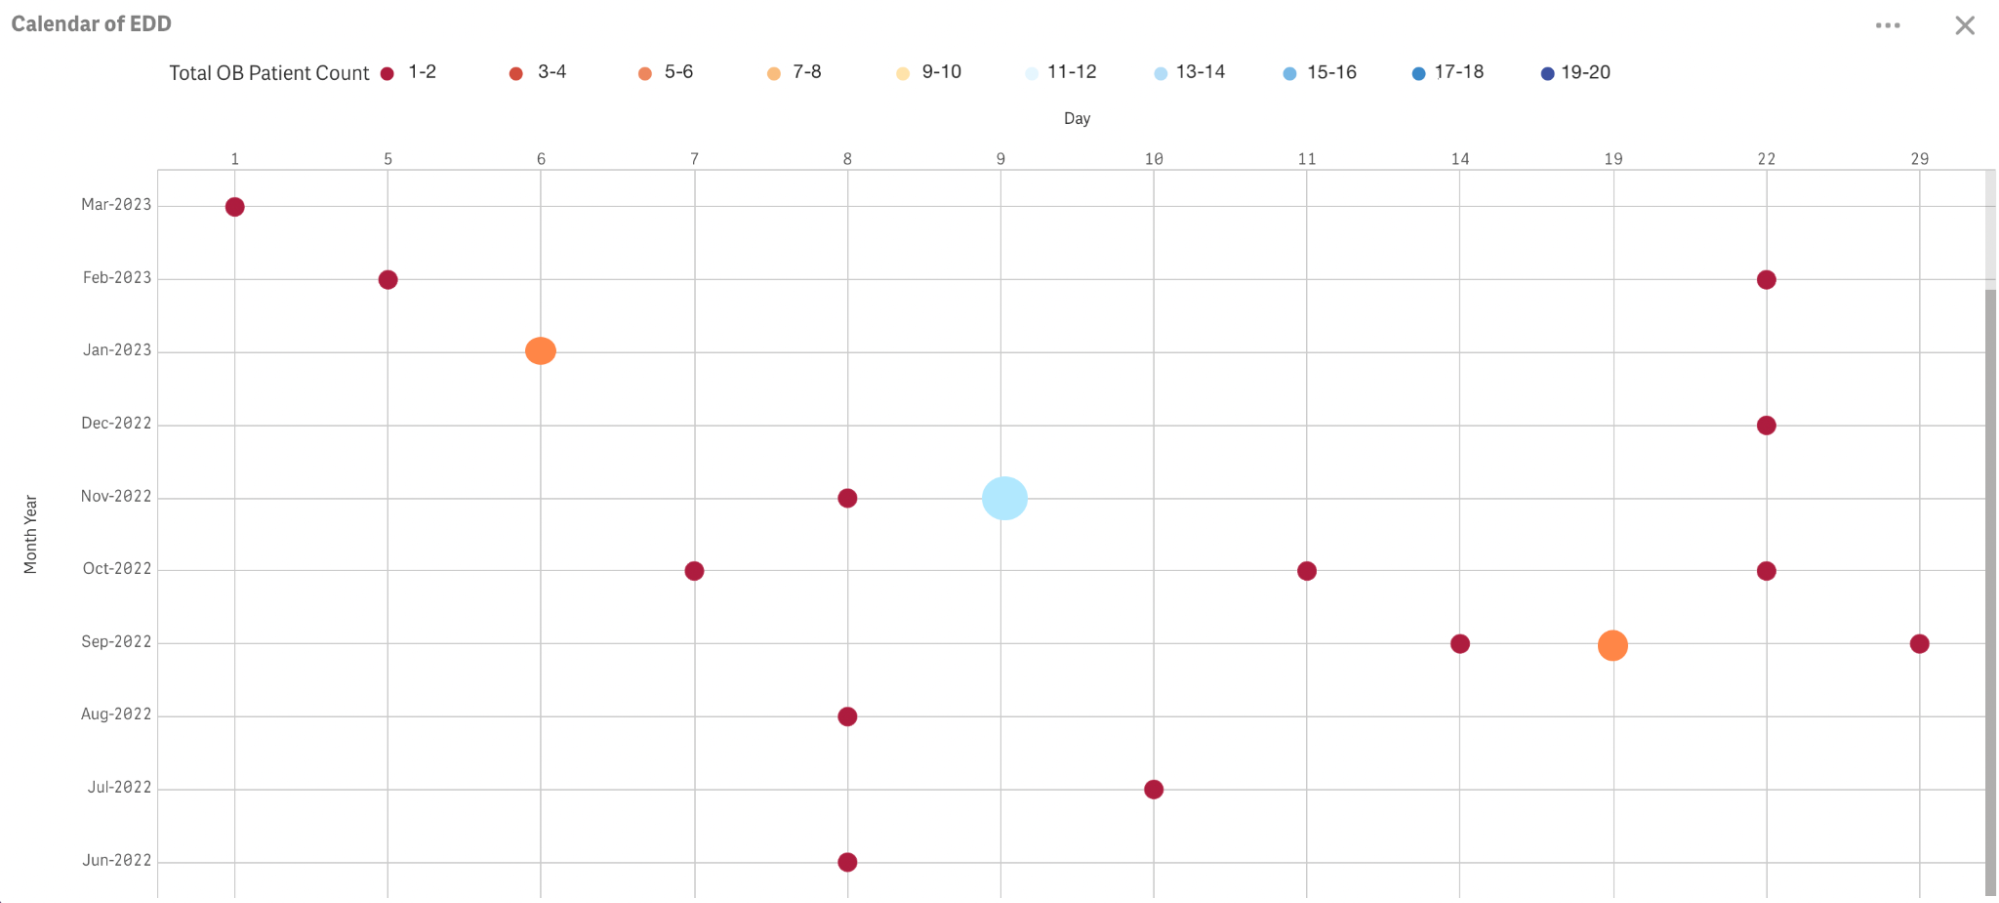
What It Shows: See a calendar view of your pregnant patients’ expected delivery dates. The size of the bubble marker on each date helps visualize the number of patients in a way that’s quick and easy for anyone in your office to understand.
Why You Need It: This view is great for planning purposes. While delivery dates may not be exact, you can use the information to ensure your provider and other resource availability aligns with patient needs.
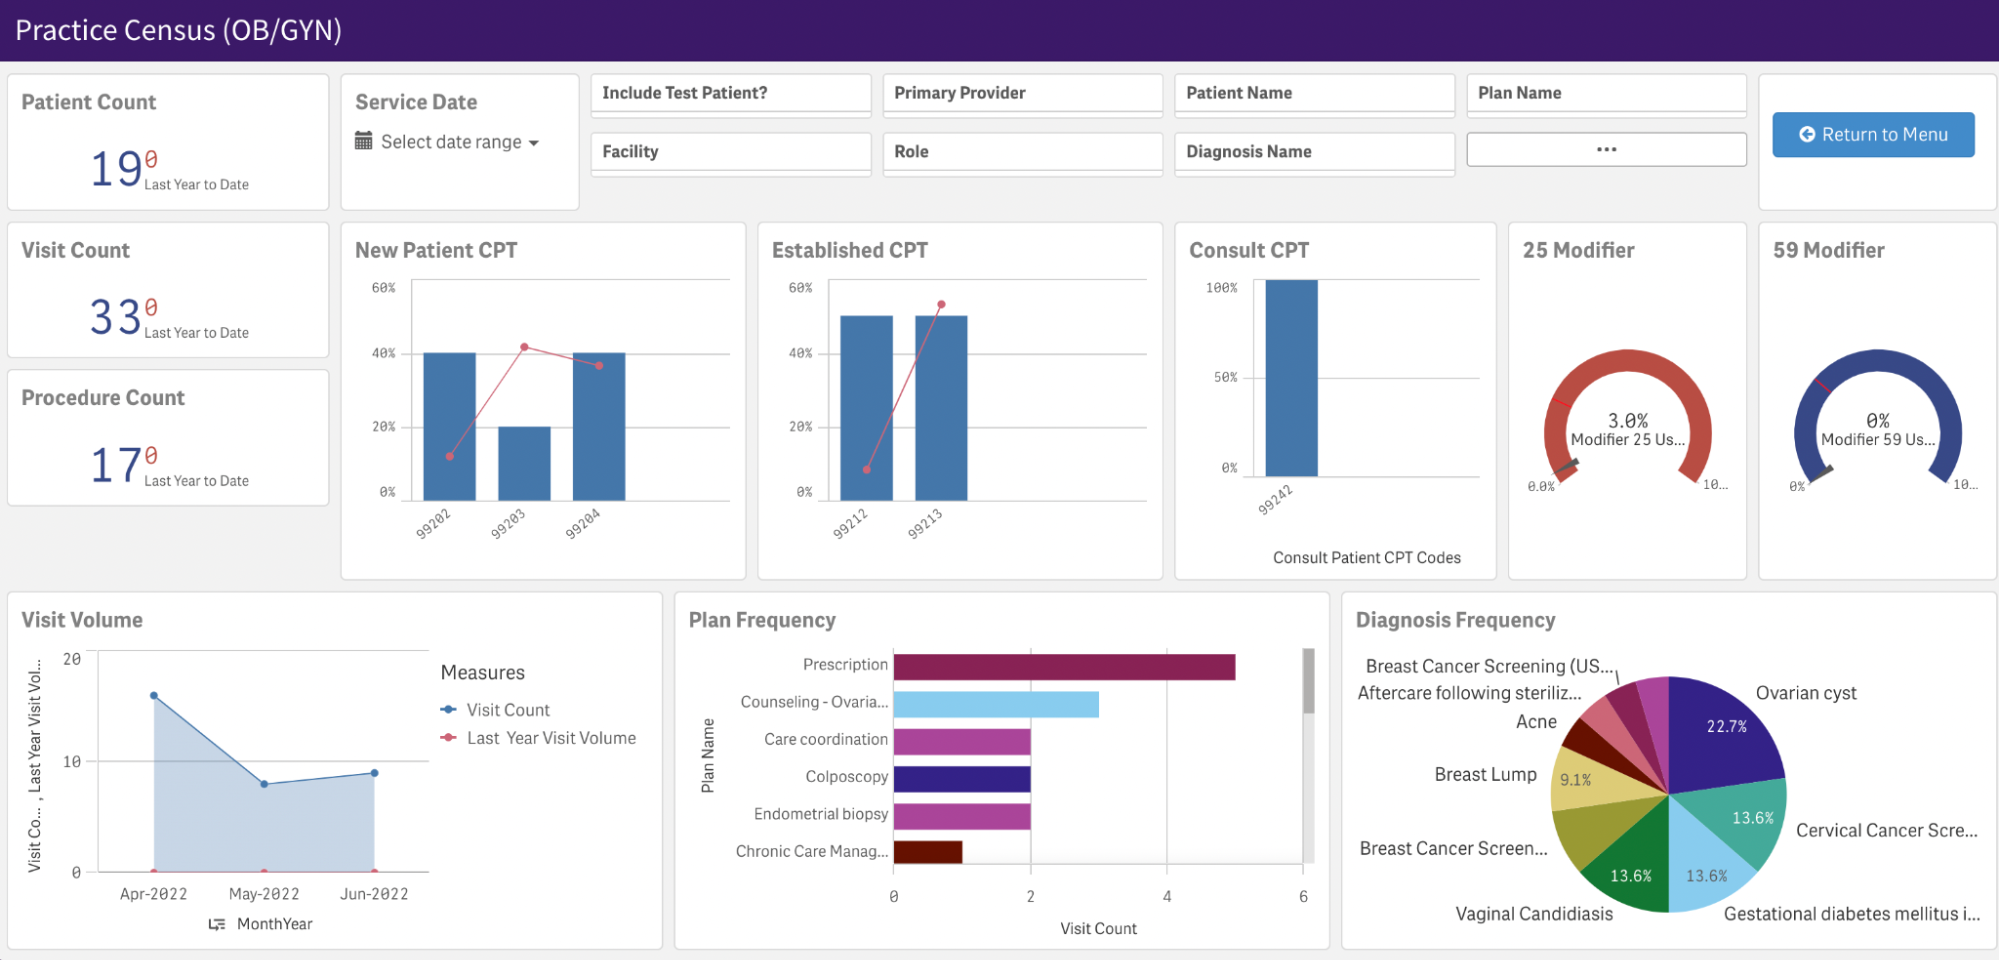
Diagnosis Drill Down
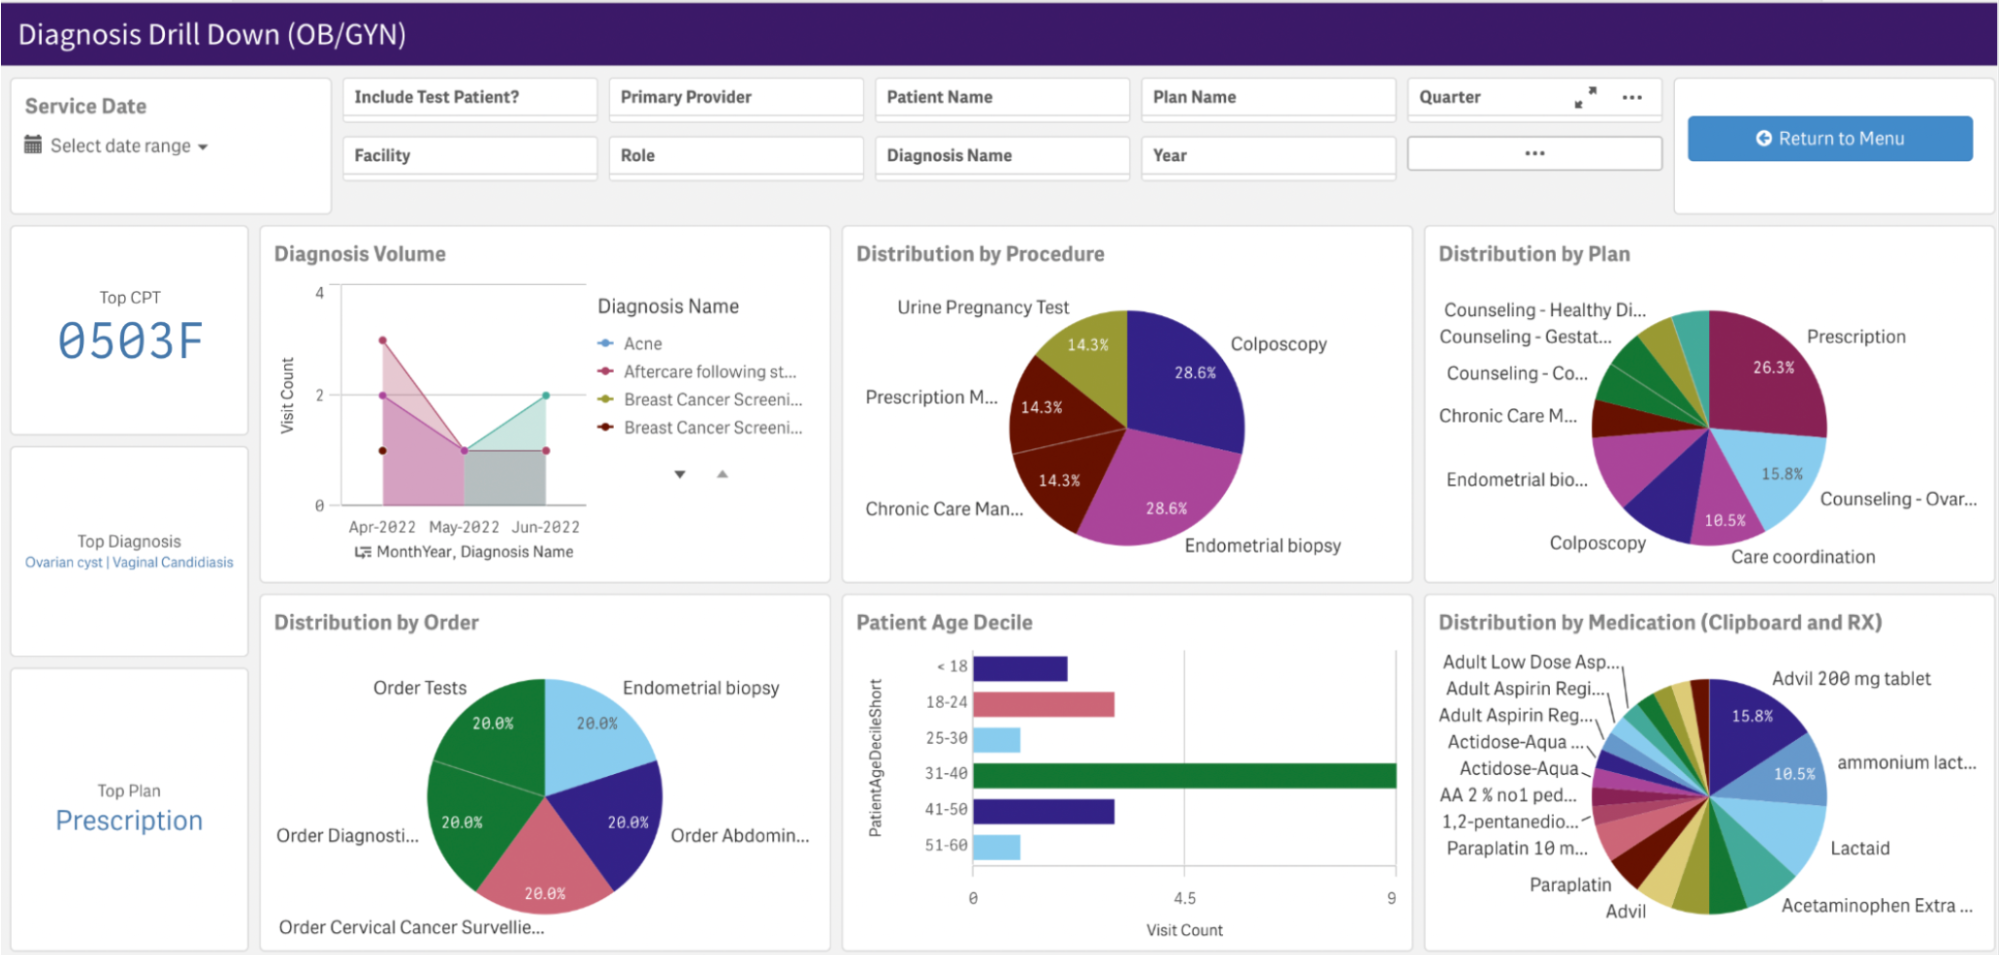
What It Shows: This view lets OBGYNs choose a diagnosis and view corresponding data trends. It’s available as part of your dashboard or in tabular form for different ways of viewing the trends that matter to you.
Why You Need It: These OBGYN analytics can help you focus your care to support more positive outcomes. For example, you may want to track pregnancy complications or your episiotomy rates. You can use this data on its own or compare it with other OBGYNs using ModMed’s Practice Census analytics. This view can also help ensure your services align with your revenue expectations.
Practice Census — E/M CPT Codes
What It Shows: Check out how your OBGYN practice is performing compared to other practices with Centers for Medicare and Medicaid (CMS) benchmarking. Our bar graph shows how often your practice is billing for certain billing codes as compared to the rest of the CMS population.
Why You Need It: Since outliers are clearly noticeable within the data visualization, this view can cue you into ways to align your practice with other OBGYNs, especially as Medicare transitions into MIPS Value Pathways.
Another way this could matter is if you see your practice is underperforming. Some OBGYNs may be performing care services without documenting them. For instance, if a patient came to you with a chief complaint of irregular bleeding, you may ask them additional questions during a review of systems (ROS). The ROS is designed to bring out clinical symptoms that the patient may have overlooked, and can help you document all clinical components that help to support the medical necessity of the visit, as well as support your medical decision-making.
OBGYN CPT and ICD Coding Summary
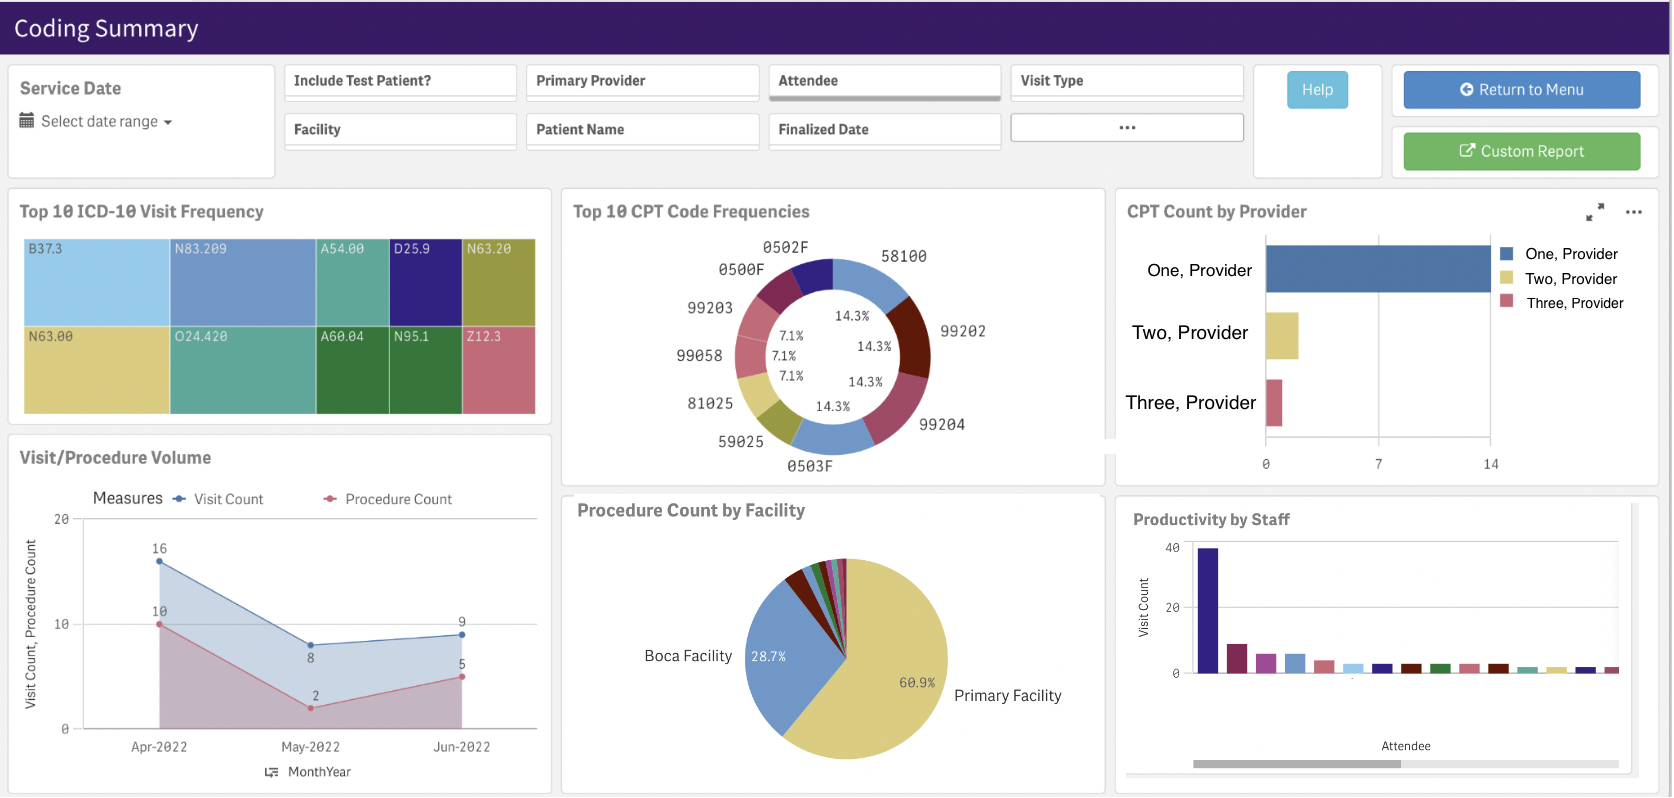
What It Shows: Grab a quick view of your practice’s overall CPT and ICD distributions, plus visit volumes. A table lists values for quick sorting, while a dashboard helps you begin to form insights at a glance. You can go deeper into the OBGYN data analysis summaries in the dashboard by using filters to look at individual facilities or tapping into the details of any of the data visualizations.
Why You Need It: The coding summary data can help form the beginning of strategies. For example, some OBGYNs may be preparing to scale upwards as Medicare postpartum care expansions start to emerge. An OBGYN practice manager may want to get a handle on current coding distributions that could lead to other insights and planning.
New/Established Patient Count Trends
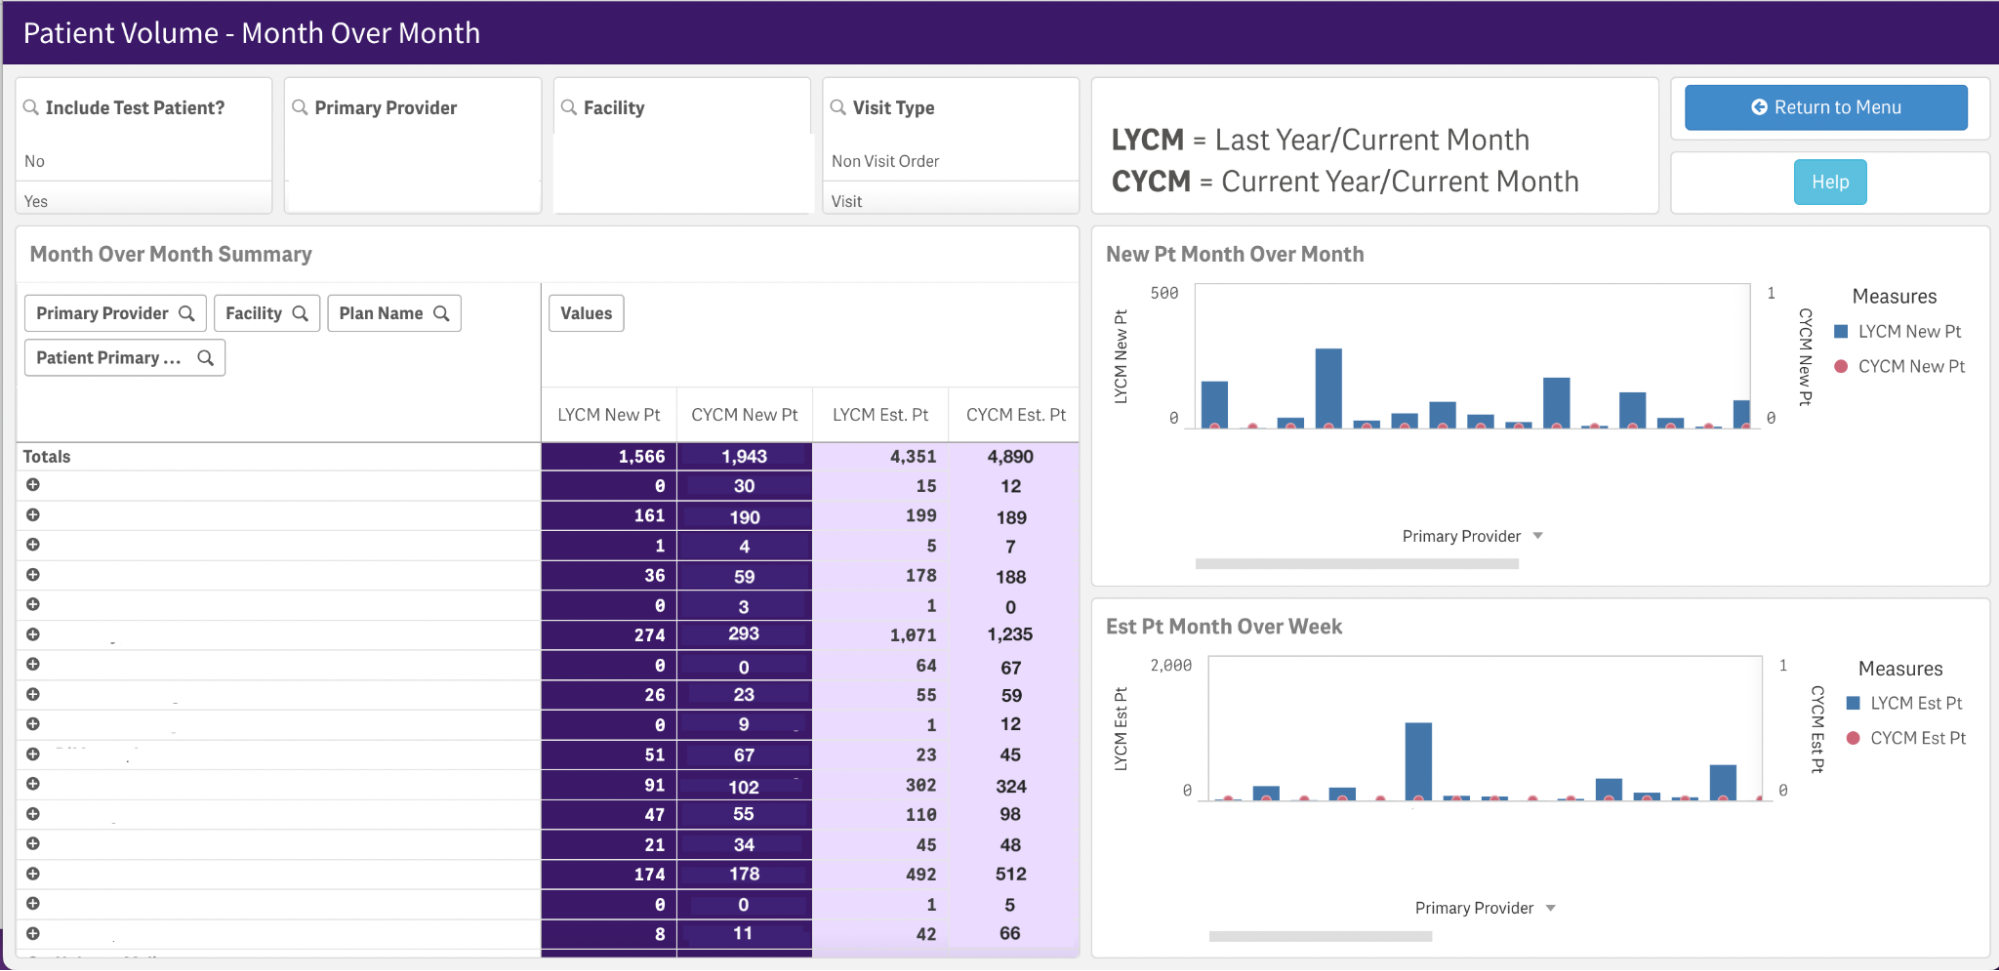
What It Shows: Compare new and established patient count trends in color-coded tabular form or by bar graph for the quickest look at breakdowns. Filter by time period, provider and facility.
Why You Need It: Understanding how business is evolving is important for OBGYNs, especially as external factors, like changes in laws and regulations, may create increased demand for care. Use this data at a high level to signify which other data points you should be tracking closely.
Preliminary Visits
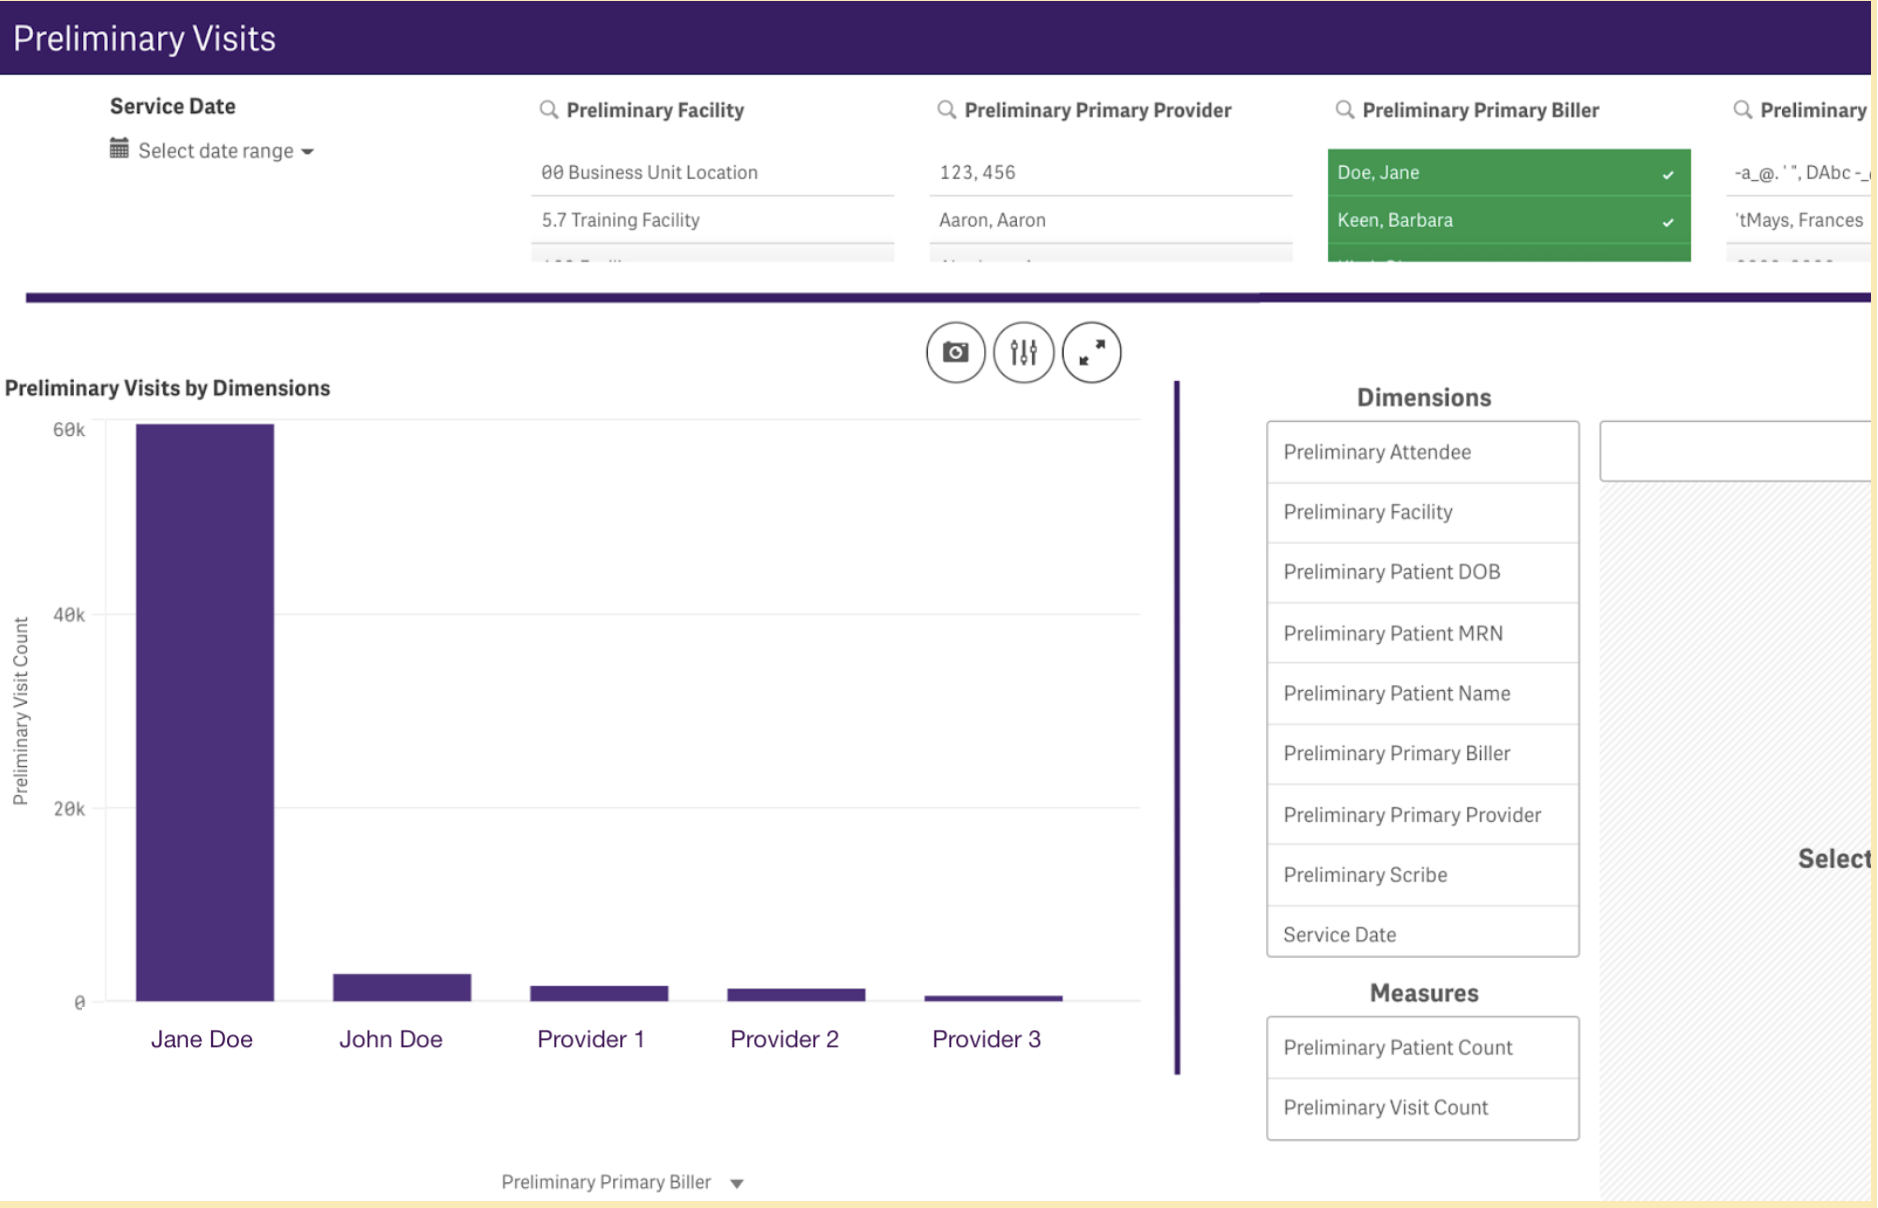
What It Shows: Visualize and track which providers have outstanding visits that need to be finalized. Filter by facility, physician or time frame.
Why You Need It: This data helps you tie up loose ends, follow up with providers who have lost track of tasks, and work to meet care and billing objectives.
OBGYN Financial Analytics
Productivity Report
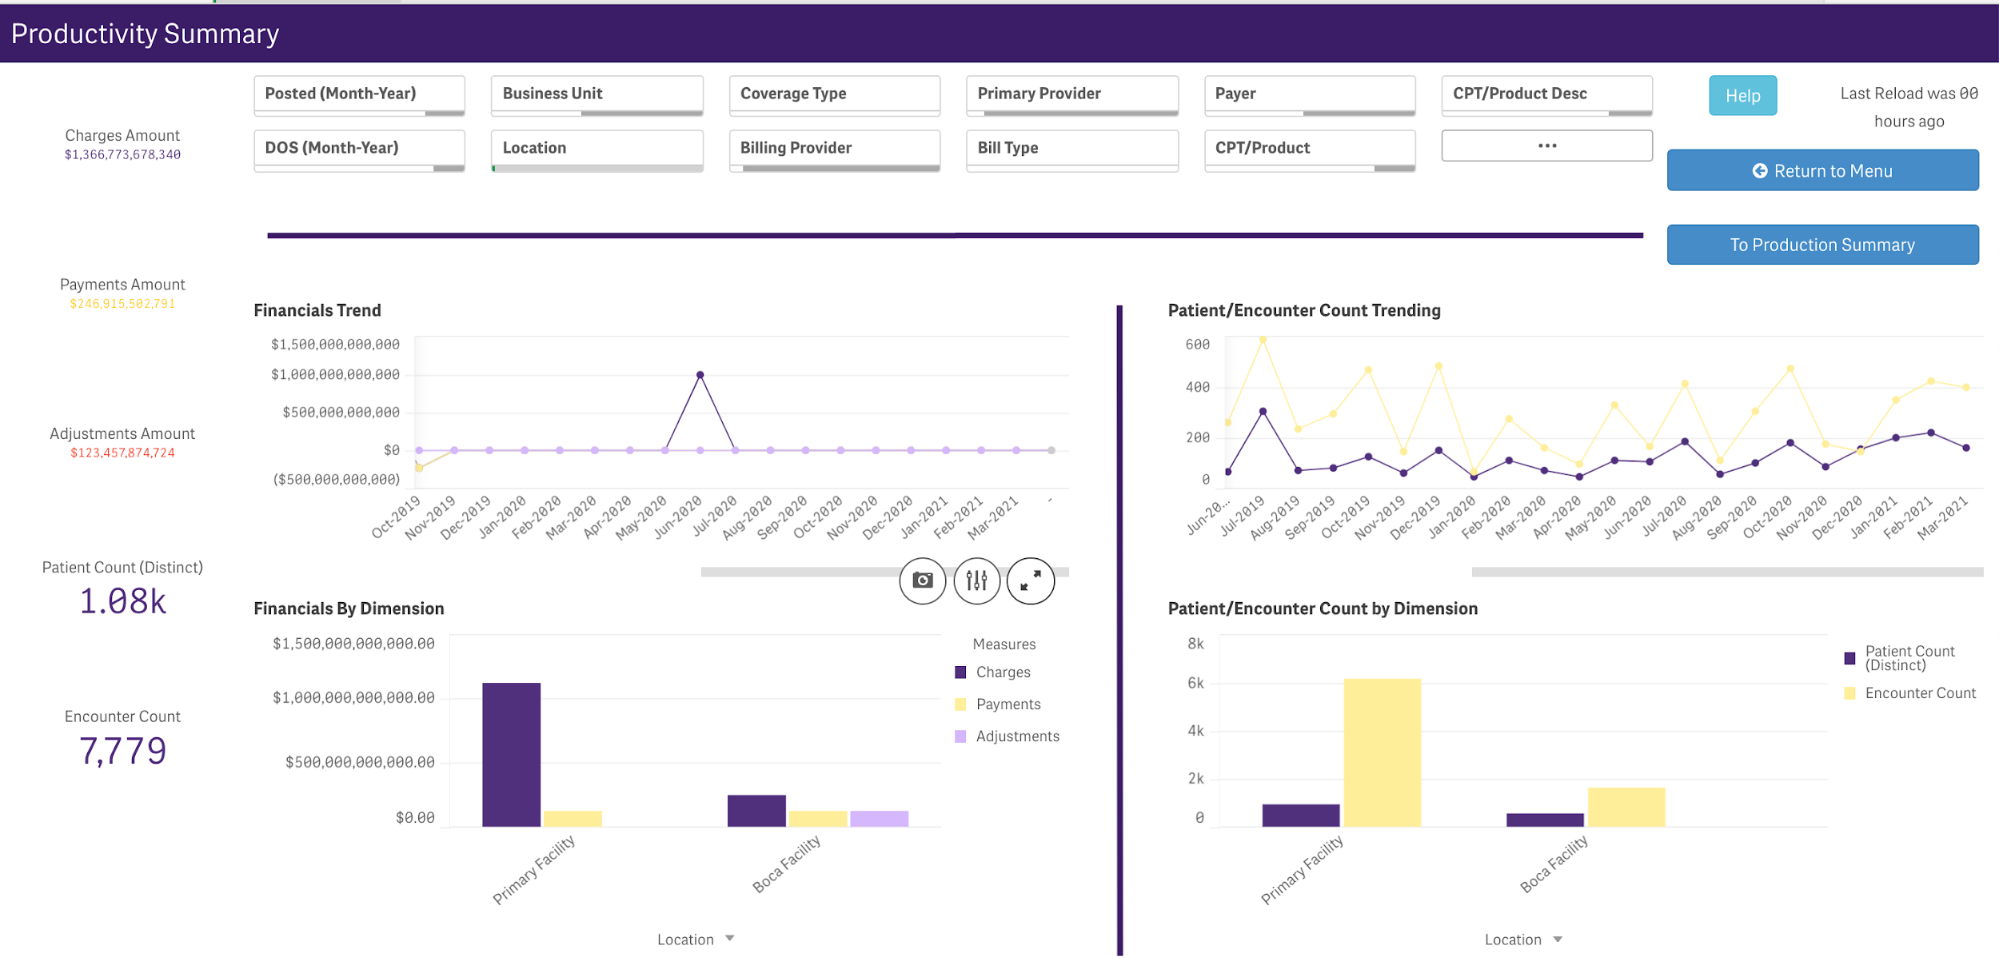
What It Shows: These comprehensive views help you surface any number of insights around productivity for your OBGYN practice. Here, you can look at charges, payments, adjustments and patient and encounter counts. You can also filter by location, provider and more. With many ways to visualize this data, you can quickly see numerical callouts, outliers in line or bar graphs, and clearly labeled timelines to address your production data analytics.
Why You Need It: A dashboard-level view of your OBGYN practice’s productivity can help you tie together insights from more granular data or indicate where you need to pull a more detailed report. It can also offer visibility into your financial situation that wasn’t available before. When you can see important information at a glance, you can identify trends and track your practice’s progress over time.
Appointment Utilization
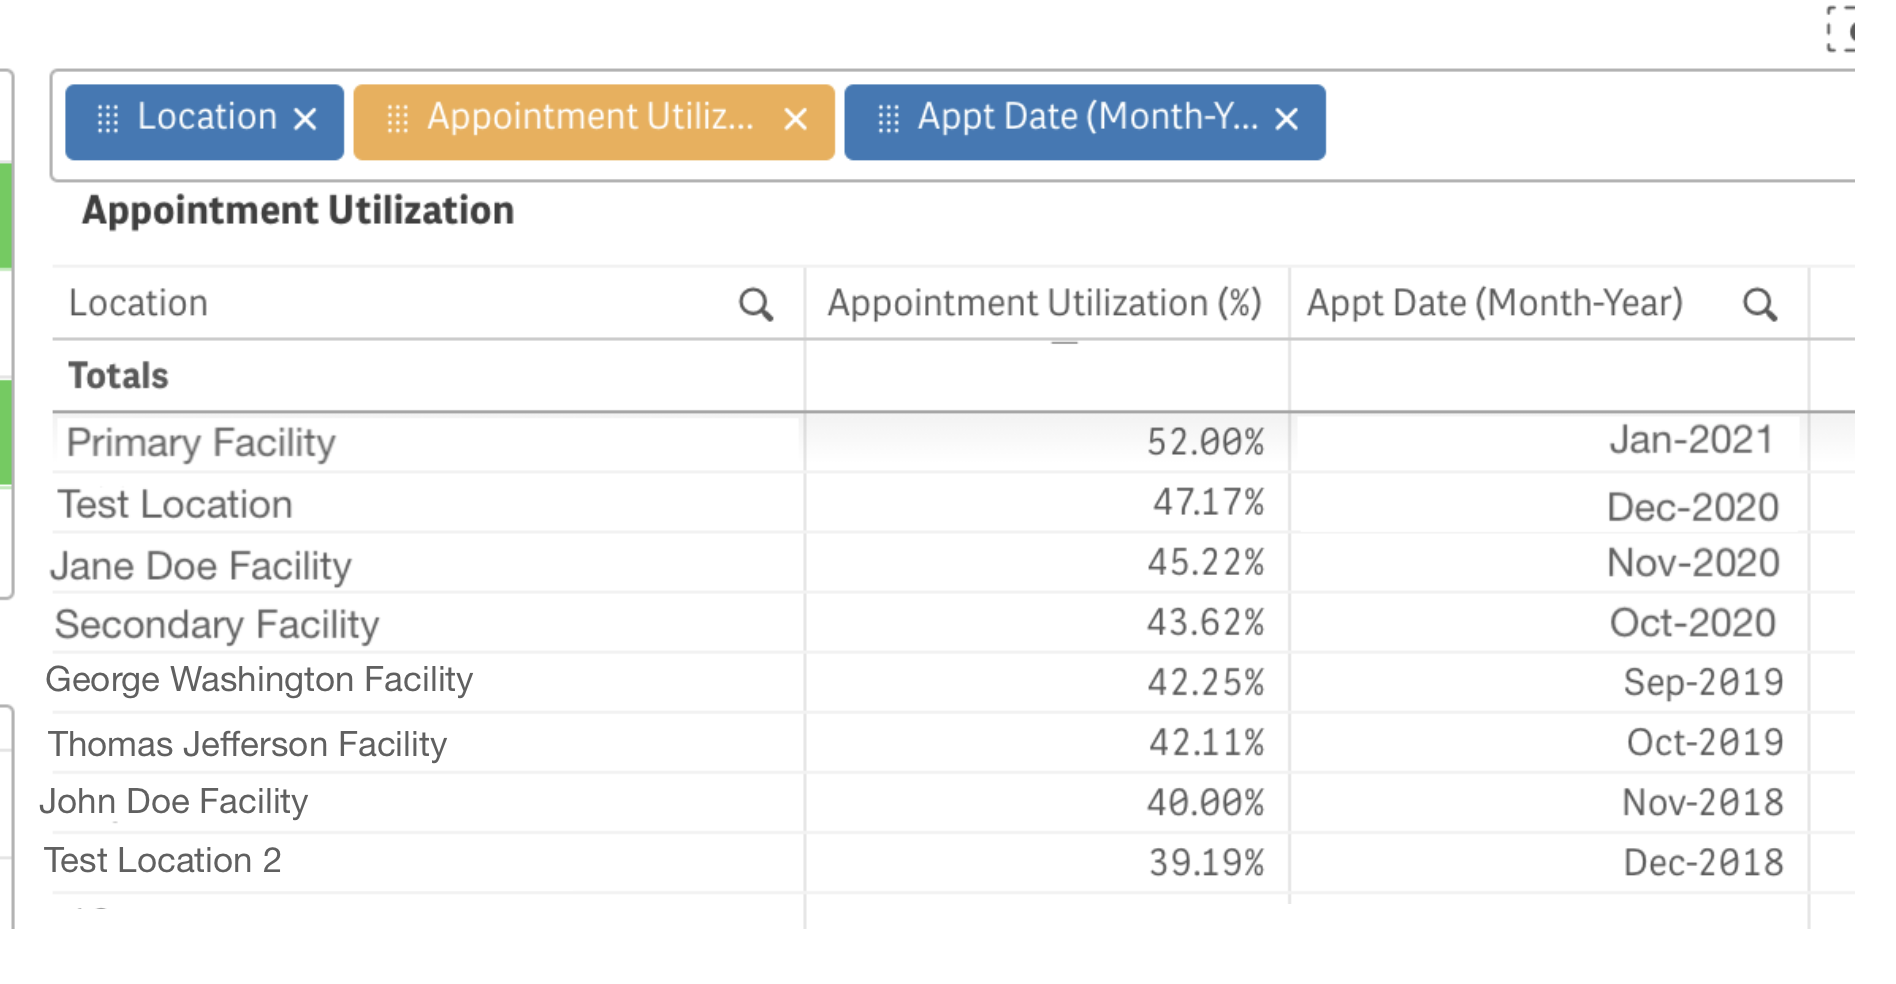
What It Shows: See how saturated your provider schedules are and discover how far out your practice is booked. Check data indicating the appointment utilization percentage over time and by facility. See how many hours and minutes you spend compared to time scheduled.
Why You Need It: This information helps you maintain a steady flow of patients over time. It helps you makesure you’re staying evenly booked for more comfortable work days for you and your staff, while filling in any time that isn’t being used to its highest and best use. Realistic schedules may mean patients may not have to wait so long to be seen, too.
Appointment Summary
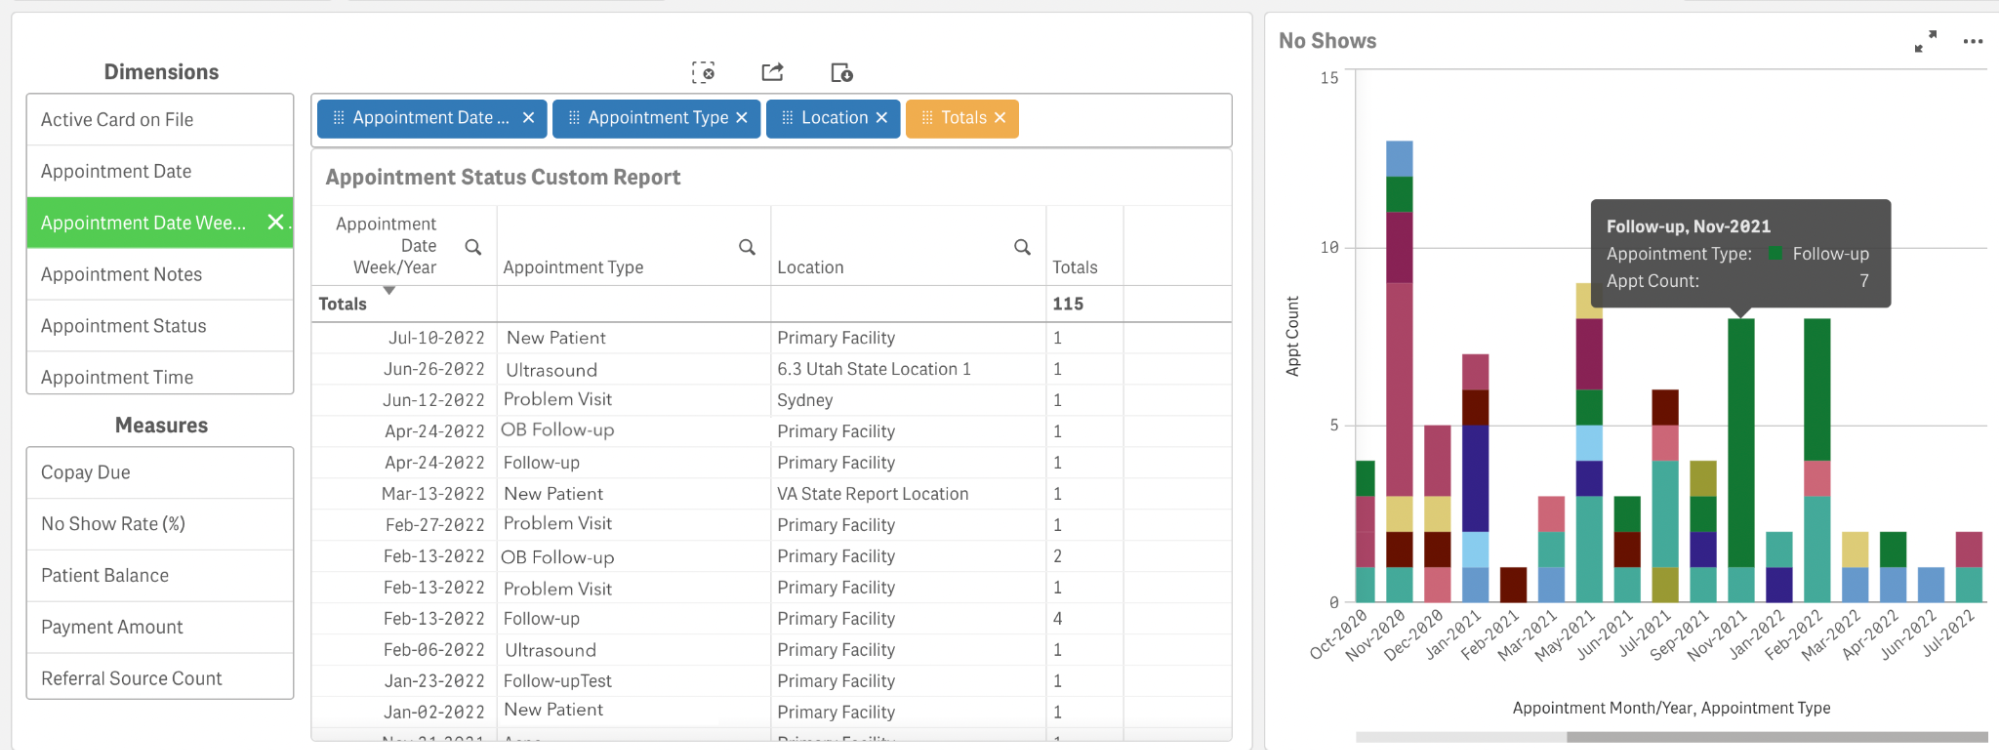
What It Shows: This summary allows you to create custom views around no-show data with the appointment status field. You can also see which patients don’t make it to appointments and when.
Why You Need It: This data can lead to plans to fill gaps in your schedule — and your bottom line. For example, if you apply these insights to your patient engagement strategies, you could help make it easier for patients to show up and get the care they need. Without this view, your OBGYN practice manager may have to comb through your schedule manually and then review patient files to identify trends in no-shows.
Payment Variance
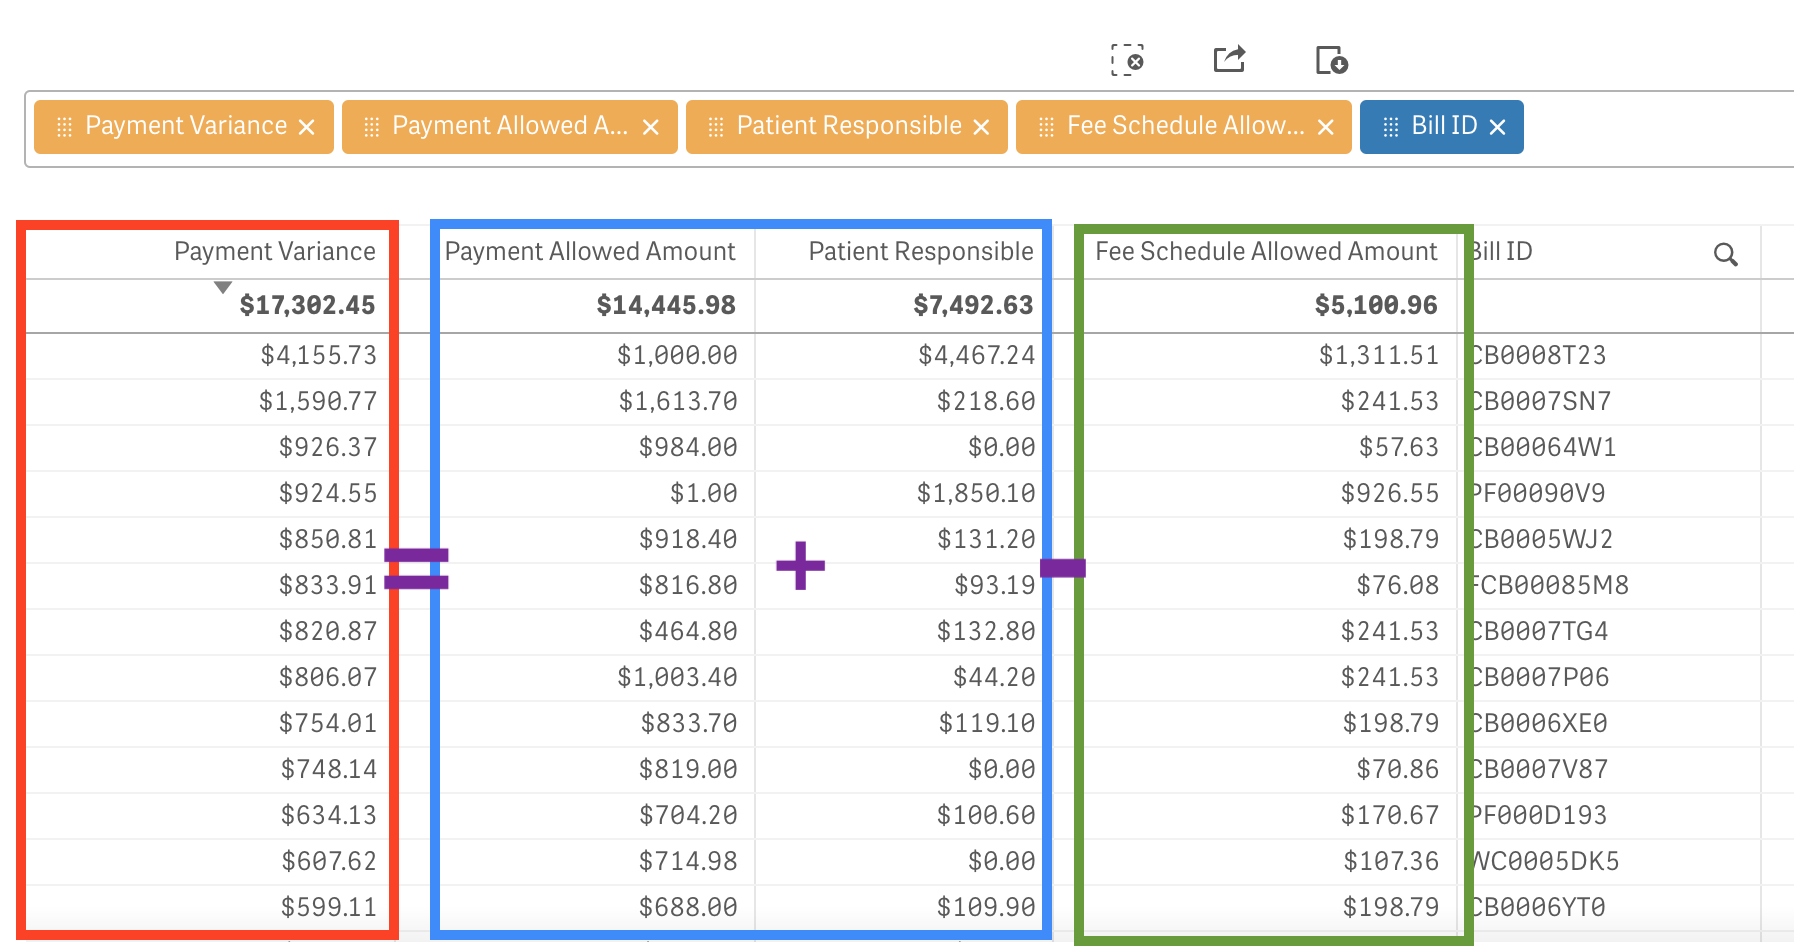
What It Shows: Find differences between what your OBGYN practice was paid and what it should have been paid, based on your fee schedule. You can see the exact breakdowns within a formula of (Payment Allowed + Patient Responsible) – Fee Schedule Allowed = Payment Variance.
Why You Need It: Staying on top of underpayment keeps your financial health strong. With time limitations impacting how long you have to claim your additional payment, it’s important to run this report regularly and take action on what you discover. If you don’t, you could miss out on any amounts that weren’t paid.
Allowable Reporting
What It Shows: See what your practice can expect to be paid based on what’s currently in your accounts receivable (AR). This is a specialized OBGYN version of a typical aging AR report used by multiple business types to determine financial health over time.
Why You Need It: This report can be helpful as a data visualization, because it can help you see at a glance how your practice may perform. If you expect different numbers, you can repeat and scale what’s working or correct what isn’t.
Appointments Missing Charges
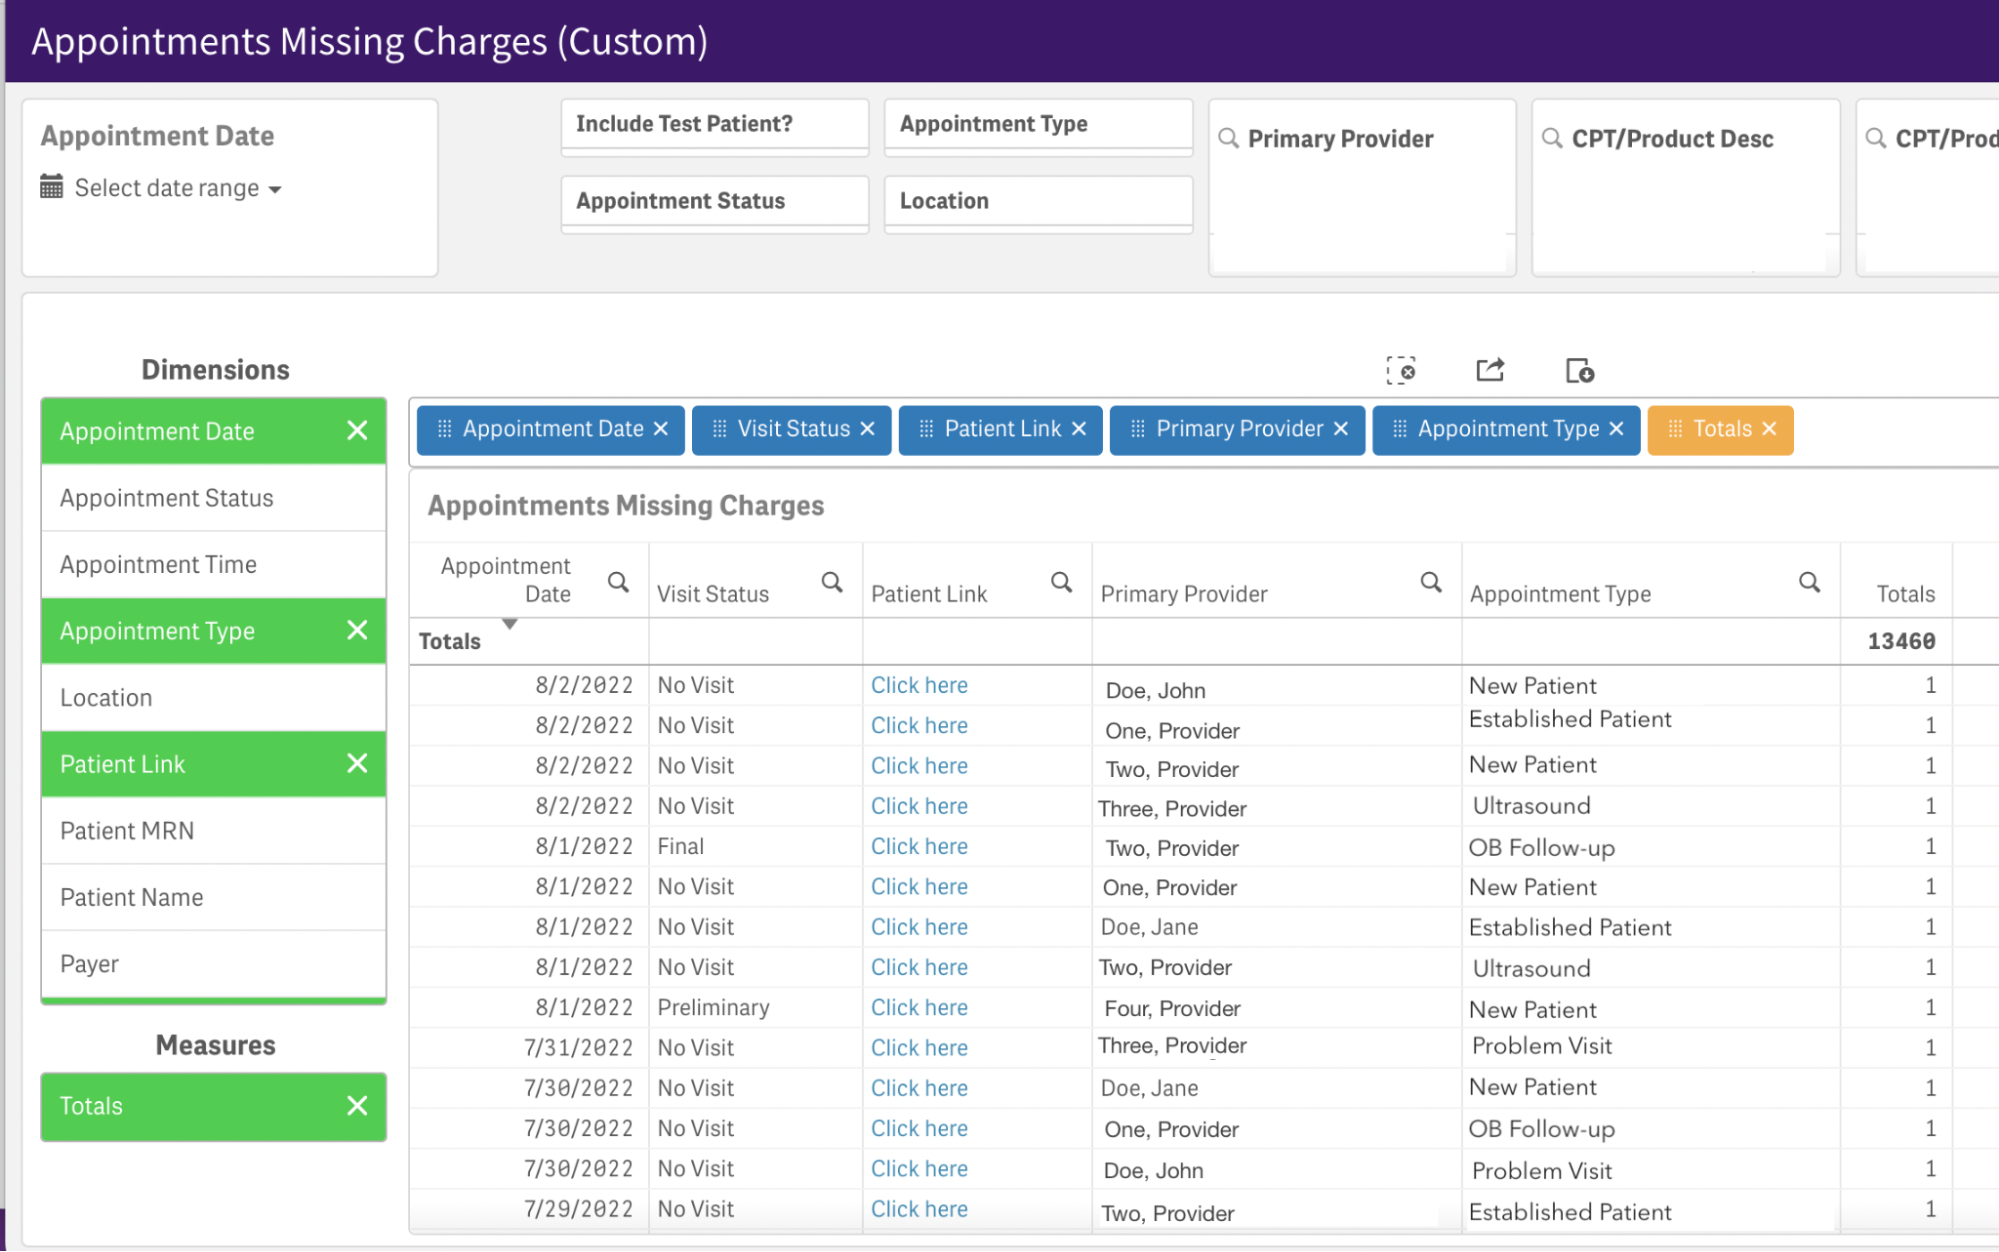
What It Shows: This set of data analytics shows you completed appointments that don’t have an associated charge created.
Why You Need It: Use this report to highlight workflow issues in visit finalization speed, visit documentation and encounter creation. Customize tags within views to quickly identify areas of potential missed revenue, so you can create and post charges in a timely manner.
Unposted and Unbilled Posted Charges
What It Shows: Unposted Charges provides a view of preliminary bills that have not yet been posted in the system. Unbilled Posted Charges focuses on charges that have been posted, but not successfully sent to payers. These analytics provide a view of revenue that may fall through the cracks without action.
Why You Need It: These insights can help you find at-risk revenue opportunities and take control of billing in a thorough, efficient and timely manner. They can also assist in highlighting issues with claims scrubbing and other problems that may prevent charges being submitted appropriately.
Targeting Reports
What They Show: Targeting reports allow you to include and exclude criteria in order to view data about specific patient populations. Within patient populations, you can look for certain scenarios, like patients who have a certain payer or a certain diagnosis, but haven’t come in for a certain procedure.
Why You Need Them: These reports are highly customizable, so you can use them to gain insights on your practices and facilities or to connect the dots to support better patient outcomes. From this data, you can also see which patients need to be engaged more deeply or which payers help fulfill your patients’ needs.
OBGYN Operational Analytics
Office Flow
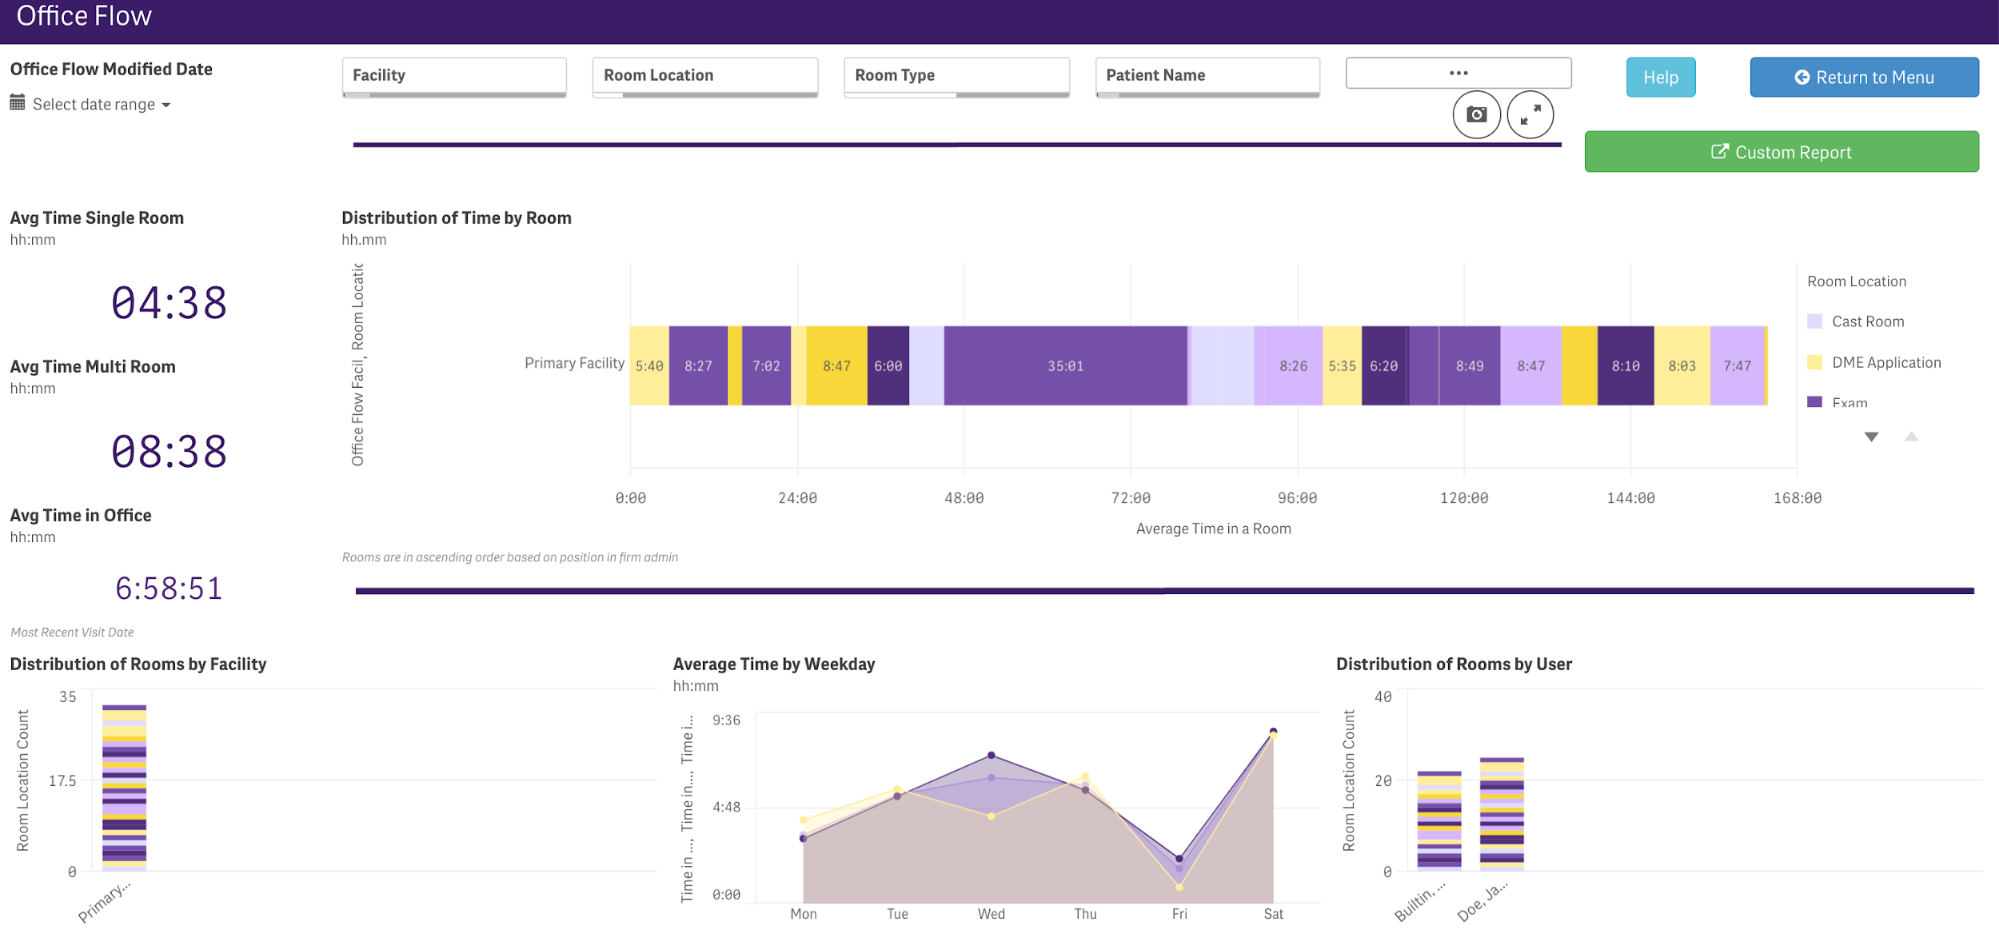
What It Shows: These data analytics can be highly actionable, allowing you to track wait times throughout the office, filtering or viewing by room, provider, attendee and days of the week in dashboard or tabular form.
Why You Need It: Help prevent office flow bottlenecks. Long wait times can weaken patient satisfaction and engagement, leading to attrition and reduced revenue.
Attendee/Scribe
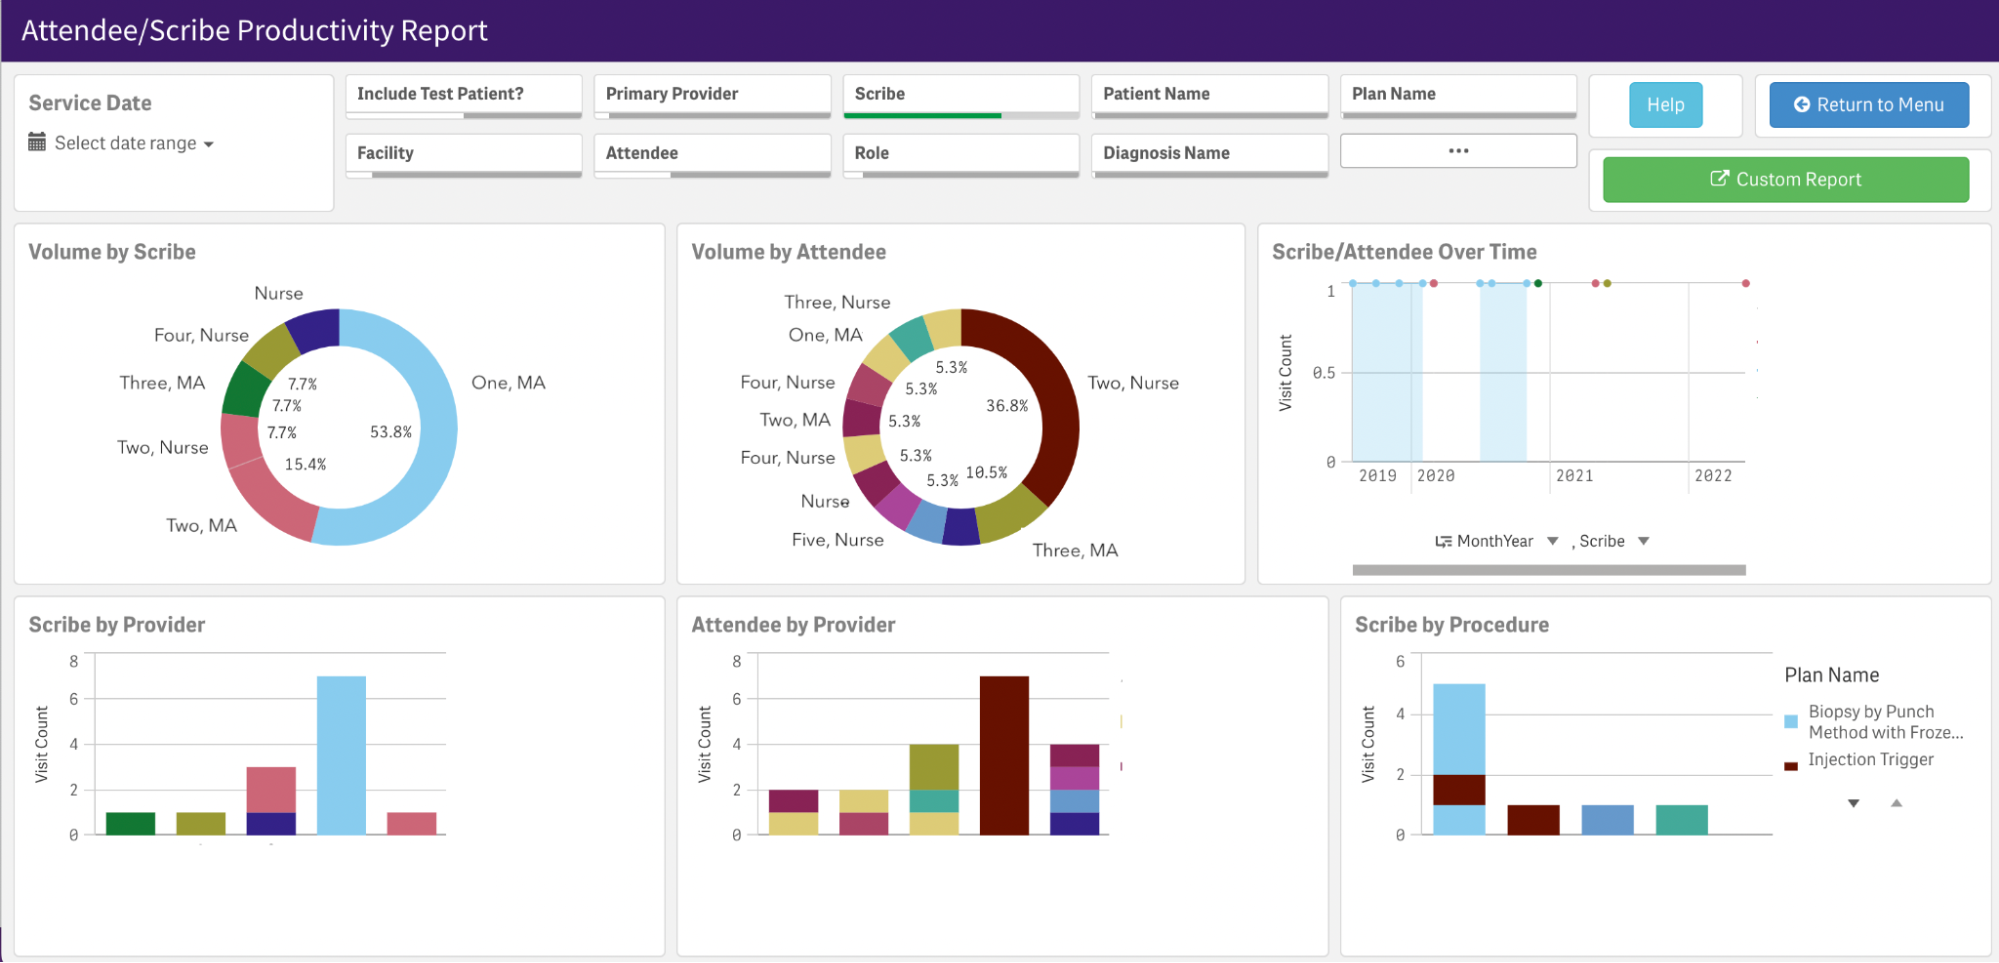
What It Shows: Use this report to view staff productivity. Visualize which staff are working with which providers or on which procedures.
Why You Need It: These analytics indicate what is happening around the individuals performing the work. While it may point to staff issues, the report can be used for more complex insights, like showing you the impact of insights from other analytics, like bottlenecks or high new patient numbers. Without this information, it may be difficult to bring relief to overburdened staff in sustainable ways. Knowing who needs what can help you strategize closely.
Time to Finalize
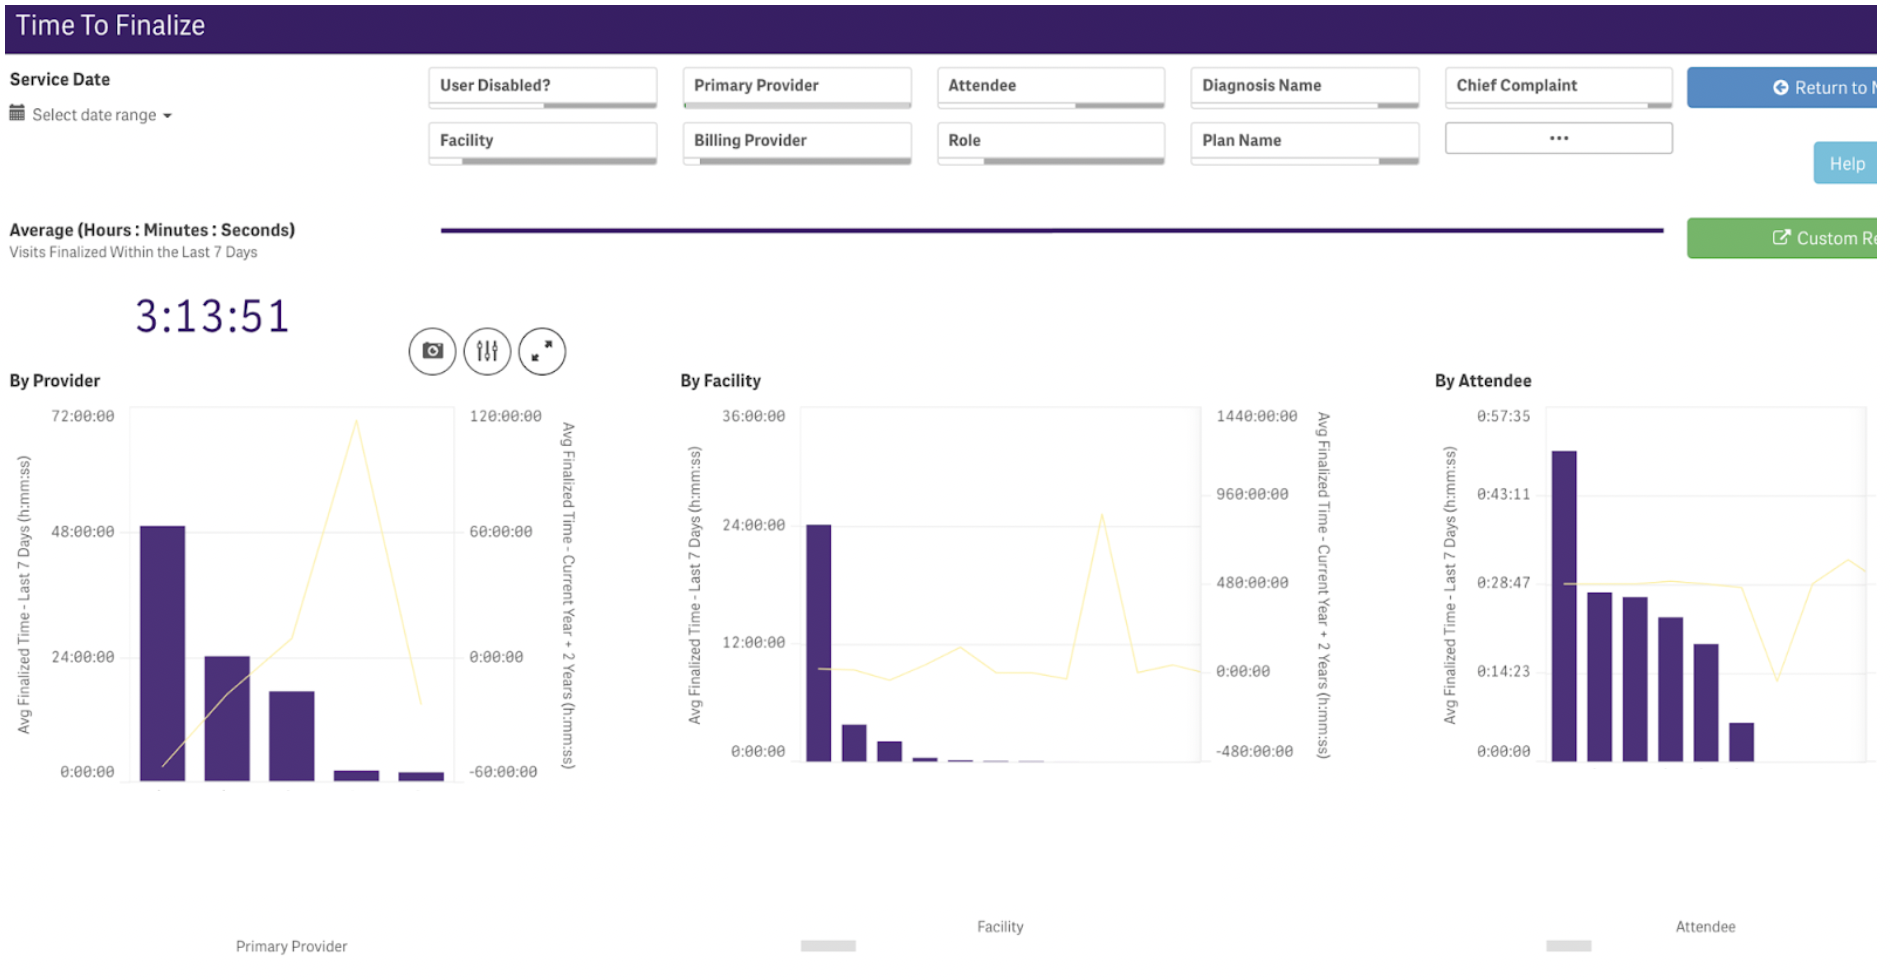
What It Shows: Track how long it takes providers to finalize their notes. Review this information in dashboard view and table view.
Why You Need It: When providers have longer times to finalize, it could mean a few different things. You may be experiencing bottlenecks that keep providers from finishing the task at hand, before they have to move on to the next one. There may also be training opportunities for new hires to learn more about how ModMed speeds OBGYN workflows. In these cases, a simple review of the software may resolve the issue. ModMed’s EHR is specifically designed for OBGYNs and was designed to eliminate unnecessary clicks and taps, keeping your staff moving throughout the day.
Practice Trends
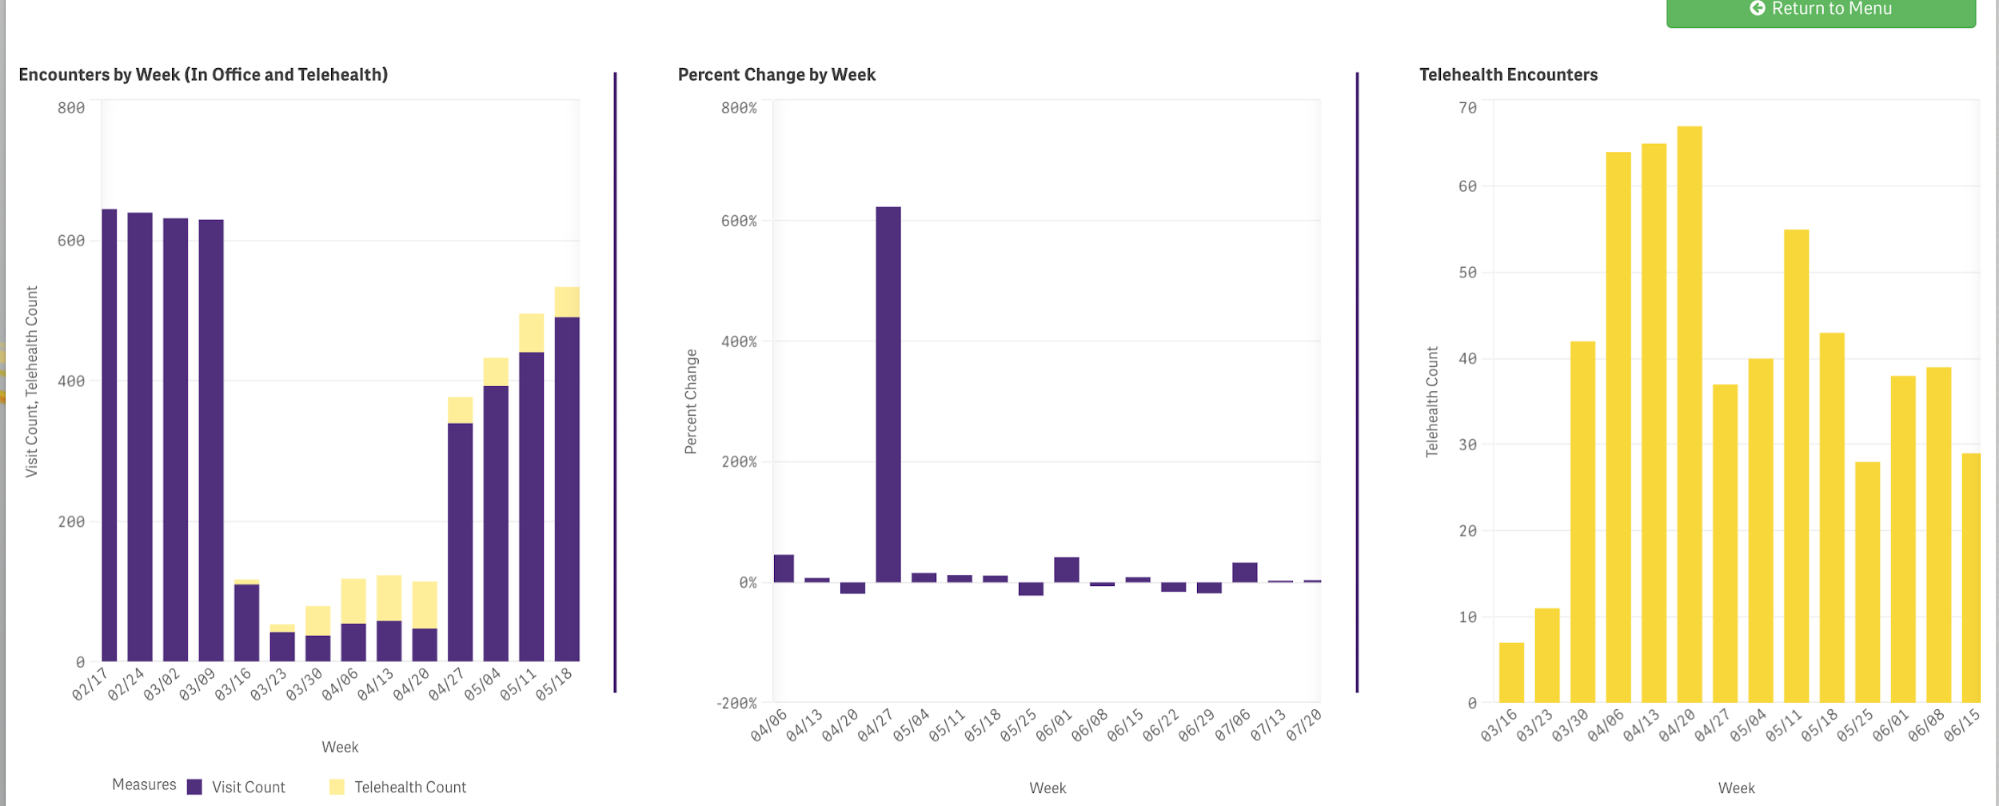
What It Shows: View encounter trends since the beginning of COVID. See how telehealth trends over time with closer looks at rates of change by time period.
Why You Need It: Keep your practice ahead of the trends with telehealth options that meet current demand levels. As patients expect more digitized experiences, this data can help you make decisions like how to allocate resources or how much to invest in patient engagement solutions.
Data-Driven Decision-Making
Explore how our OBGYN data analytics solution can help you identify ways to boost your practice’s performance in a measurable way. With high-contrast graphics and tables that are easy to pull and review, our analytics are designed to identify powerful trends and help make results more predictable.
Do more with your OBGYN data. Book a demo to see the analytics you need in action.
This blog is intended for informational purposes only and does not constitute legal or medical advice. Please consult with your legal counsel and other qualified advisors to ensure compliance with applicable laws, regulations, and standards.