
Welcome Back
Get a demo.


Sharing words of wisdom in The Doctor’s Note
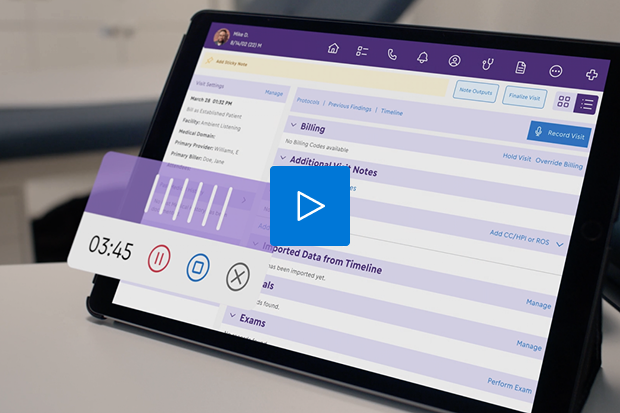
ModMed Scribe: AI-powered software to speed documentation

Finding an all-in-one system

Lock in our lowest rates and learn how to build your AI-Powered Practice™ at MOMENTUM.

Where do you stand on AI in healthcare?
What could you do to improve your care?
Is your practice losing money? If so, where?


Visualize and benchmark clinical data at a high level


See how you’re performing relative to your specialty peers


If you use Practice Management, dig deep into your billing revenue cycle


Filter each report by a wide range of parameters, such as:
Augmenting the built-in reports in EMA® and Practice Management, Analytics brings together the clinical, financial and operational data that you collect inside our suite. In just a few clicks, you can drill down from enterprise level to provider level and even patient level.
By tracking, benchmarking and truly understanding your performance with Analytics, you can help uncover ways to improve—efficiency, profitability, patient outcomes and beyond. This, in turn, puts your practice in a better position for long-term success.

Flexible Data Solutions to Meet Your Practice’s Needs
Included with EMA, Data Explorer is a self-service solution that gives you the flexibility to explore raw data, on your own, to answer specific questions. Pre-specified data sets offered with Data Explorer include patient demographics and history, prescribed medications, referral sources, exam details, billable charges and more. With access to your practice’s data, you can build reports with multiple dimensions and export them for further manipulation and analysis.
In the healthcare industry, data analytics is generally categorized into four progressive stages that help practices move from understanding the past to predicting the future:
Data-driven insights allow healthcare organizations to transition from reactive to proactive management. Key benefits include:
Yes. Unlike one-size-fits-all platforms, ModMed Analytics is built on structured data tailored to the unique workflows of specific medical specialties. For example, our OBGYN analytics can track delivery methods and OB projections, while our orthopedics dashboard allows providers to drill down into specific diagnoses, imaging orders, and pain scale trends. By speaking the language of your specialty, our analytics help you keep track of your practice performance.
Absolutely. ModMed’s platform provides granular visibility into individual provider performance across clinical, financial, and operational metrics. Administrators can track:
ModMed’s analytics dashboards are designed for both ease of use and deep flexibility. Our Premium Analytics tools allow you to:
Schedule a Demo Today!
